
Advertisement
- China
- /
- Semiconductors
- /
- SZSE:301321
Highbroad Advanced Material (Hefei) Co., Ltd. (SZSE:301321) Stock Catapults 32% Though Its Price And Business Still Lag The Industry
Highbroad Advanced Material (Hefei) Co., Ltd. (SZSE:301321) shareholders are no doubt pleased to see that the share price has bounced 32% in the last month, although it is still struggling to make up recently lost ground. Unfortunately, the gains of the last month did little to right the losses of the last year with the stock still down 13% over that time.
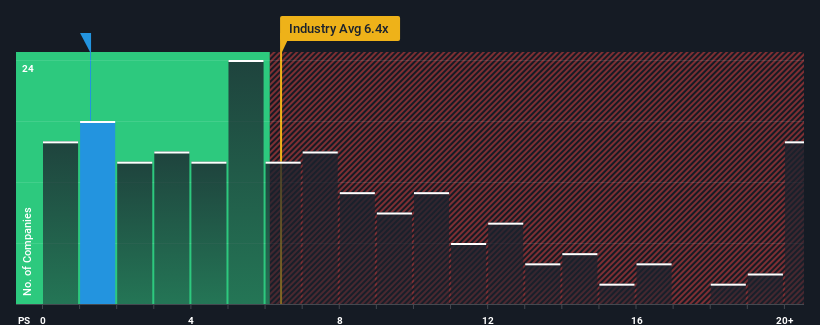
Even after such a large jump in price, Highbroad Advanced Material (Hefei)'s price-to-sales (or "P/S") ratio of 1.3x might still make it look like a strong buy right now compared to the wider Semiconductor industry in China, where around half of the companies have P/S ratios above 6.4x and even P/S above 11x are quite common. Nonetheless, we'd need to dig a little deeper to determine if there is a rational basis for the highly reduced P/S.
View our latest analysis for Highbroad Advanced Material (Hefei)
How Has Highbroad Advanced Material (Hefei) Performed Recently?
For instance, Highbroad Advanced Material (Hefei)'s receding revenue in recent times would have to be some food for thought. It might be that many expect the disappointing revenue performance to continue or accelerate, which has repressed the P/S. Those who are bullish on Highbroad Advanced Material (Hefei) will be hoping that this isn't the case so that they can pick up the stock at a lower valuation.
We don't have analyst forecasts, but you can see how recent trends are setting up the company for the future by checking out our free report on Highbroad Advanced Material (Hefei)'s earnings, revenue and cash flow.What Are Revenue Growth Metrics Telling Us About The Low P/S?
In order to justify its P/S ratio, Highbroad Advanced Material (Hefei) would need to produce anemic growth that's substantially trailing the industry.
Taking a look back first, the company's revenue growth last year wasn't something to get excited about as it posted a disappointing decline of 27%. As a result, revenue from three years ago have also fallen 15% overall. Therefore, it's fair to say the revenue growth recently has been undesirable for the company.
Weighing that medium-term revenue trajectory against the broader industry's one-year forecast for expansion of 37% shows it's an unpleasant look.
With this in mind, we understand why Highbroad Advanced Material (Hefei)'s P/S is lower than most of its industry peers. Nonetheless, there's no guarantee the P/S has reached a floor yet with revenue going in reverse. There's potential for the P/S to fall to even lower levels if the company doesn't improve its top-line growth.
The Bottom Line On Highbroad Advanced Material (Hefei)'s P/S
Even after such a strong price move, Highbroad Advanced Material (Hefei)'s P/S still trails the rest of the industry. While the price-to-sales ratio shouldn't be the defining factor in whether you buy a stock or not, it's quite a capable barometer of revenue expectations.
As we suspected, our examination of Highbroad Advanced Material (Hefei) revealed its shrinking revenue over the medium-term is contributing to its low P/S, given the industry is set to grow. At this stage investors feel the potential for an improvement in revenue isn't great enough to justify a higher P/S ratio. Unless the recent medium-term conditions improve, they will continue to form a barrier for the share price around these levels.
Before you take the next step, you should know about the 4 warning signs for Highbroad Advanced Material (Hefei) that we have uncovered.
Of course, profitable companies with a history of great earnings growth are generally safer bets. So you may wish to see this free collection of other companies that have reasonable P/E ratios and have grown earnings strongly.
Valuation is complex, but we're here to simplify it.
Discover if Highbroad Advanced Material (Hefei) might be undervalued or overvalued with our detailed analysis, featuring fair value estimates, potential risks, dividends, insider trades, and its financial condition.
Access Free AnalysisHave feedback on this article? Concerned about the content? Get in touch with us directly. Alternatively, email editorial-team (at) simplywallst.com.
This article by Simply Wall St is general in nature. We provide commentary based on historical data and analyst forecasts only using an unbiased methodology and our articles are not intended to be financial advice. It does not constitute a recommendation to buy or sell any stock, and does not take account of your objectives, or your financial situation. We aim to bring you long-term focused analysis driven by fundamental data. Note that our analysis may not factor in the latest price-sensitive company announcements or qualitative material. Simply Wall St has no position in any stocks mentioned.
About SZSE:301321
Highbroad Advanced Material (Hefei)
Highbroad Advanced Material (Hefei) Co., Ltd.
Low risk and slightly overvalued.
Market Insights

Advertisement
Community Narratives
MINISO's fair value is projected at 26.69 with an anticipated PE ratio shift of 20x
Fair Value US$24.03|11.0% undervalued
BE
Community Contributor
Procter & Gamble: A Dividend Giant Facing Slowing Growth
Fair Value US$119.81|23.3% overvalued
AN
Community Contributor
Eli Lilly's Future Growth Driven by Tirzepatide and Favorable Market Conditions
Fair Value US$1.19k|13.8% undervalued
EA
Community Contributor