
Advertisement
- China
- /
- Semiconductors
- /
- SZSE:300776
Capital Allocation Trends At Wuhan DR Laser TechnologyLtd (SZSE:300776) Aren't Ideal

Did you know there are some financial metrics that can provide clues of a potential multi-bagger? Ideally, a business will show two trends; firstly a growing return on capital employed (ROCE) and secondly, an increasing amount of capital employed. Put simply, these types of businesses are compounding machines, meaning they are continually reinvesting their earnings at ever-higher rates of return. Having said that, from a first glance at Wuhan DR Laser TechnologyLtd (SZSE:300776) we aren't jumping out of our chairs at how returns are trending, but let's have a deeper look.
What Is Return On Capital Employed (ROCE)?
Just to clarify if you're unsure, ROCE is a metric for evaluating how much pre-tax income (in percentage terms) a company earns on the capital invested in its business. Analysts use this formula to calculate it for Wuhan DR Laser TechnologyLtd:
Return on Capital Employed = Earnings Before Interest and Tax (EBIT) ÷ (Total Assets - Current Liabilities)
0.11 = CN¥396m ÷ (CN¥6.3b - CN¥2.6b) (Based on the trailing twelve months to September 2023).
So, Wuhan DR Laser TechnologyLtd has an ROCE of 11%. On its own, that's a standard return, however it's much better than the 5.5% generated by the Semiconductor industry.
View our latest analysis for Wuhan DR Laser TechnologyLtd
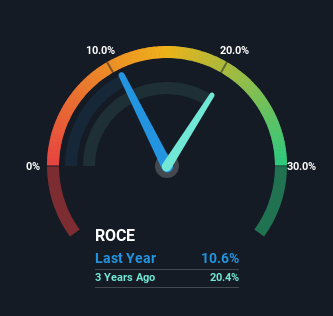
Above you can see how the current ROCE for Wuhan DR Laser TechnologyLtd compares to its prior returns on capital, but there's only so much you can tell from the past. If you'd like, you can check out the forecasts from the analysts covering Wuhan DR Laser TechnologyLtd for free.
How Are Returns Trending?
On the surface, the trend of ROCE at Wuhan DR Laser TechnologyLtd doesn't inspire confidence. To be more specific, ROCE has fallen from 59% over the last five years. On the other hand, the company has been employing more capital without a corresponding improvement in sales in the last year, which could suggest these investments are longer term plays. It's worth keeping an eye on the company's earnings from here on to see if these investments do end up contributing to the bottom line.
On a related note, Wuhan DR Laser TechnologyLtd has decreased its current liabilities to 41% of total assets. So we could link some of this to the decrease in ROCE. Effectively this means their suppliers or short-term creditors are funding less of the business, which reduces some elements of risk. Some would claim this reduces the business' efficiency at generating ROCE since it is now funding more of the operations with its own money. Either way, they're still at a pretty high level, so we'd like to see them fall further if possible.
The Bottom Line On Wuhan DR Laser TechnologyLtd's ROCE
To conclude, we've found that Wuhan DR Laser TechnologyLtd is reinvesting in the business, but returns have been falling. And with the stock having returned a mere 1.7% in the last three years to shareholders, you could argue that they're aware of these lackluster trends. So if you're looking for a multi-bagger, the underlying trends indicate you may have better chances elsewhere.
On a separate note, we've found 1 warning sign for Wuhan DR Laser TechnologyLtd you'll probably want to know about.
While Wuhan DR Laser TechnologyLtd may not currently earn the highest returns, we've compiled a list of companies that currently earn more than 25% return on equity. Check out this free list here.
Valuation is complex, but we're here to simplify it.
Discover if Wuhan DR Laser TechnologyLtd might be undervalued or overvalued with our detailed analysis, featuring fair value estimates, potential risks, dividends, insider trades, and its financial condition.
Access Free AnalysisHave feedback on this article? Concerned about the content? Get in touch with us directly. Alternatively, email editorial-team (at) simplywallst.com.
This article by Simply Wall St is general in nature. We provide commentary based on historical data and analyst forecasts only using an unbiased methodology and our articles are not intended to be financial advice. It does not constitute a recommendation to buy or sell any stock, and does not take account of your objectives, or your financial situation. We aim to bring you long-term focused analysis driven by fundamental data. Note that our analysis may not factor in the latest price-sensitive company announcements or qualitative material. Simply Wall St has no position in any stocks mentioned.
About SZSE:300776
Wuhan DR Laser TechnologyLtd
Engages in the manufacture and sale of laser equipment for solar cell applications in China and internationally.
Adequate balance sheet and fair value.
Market Insights


Advertisement
Community Narratives
Alphabet: The Under-appreciated Compounder Hiding in Plain Sight
Fair Value US$282.83|31.8% undervalued
BL
Community Contributor
Planet Labs: At The Heart Of The Emerging New Space Boom
Fair Value US$11.31|44.7% undervalued
AN
Community Contributor
Exxon in Guyana 5 year forecast Low $135 to High $189
Fair Value US$189.00|40.9% undervalued
AG
Community Contributor