
Advertisement
- China
- /
- Semiconductors
- /
- SZSE:002992
Shenzhen Baoming Technology Co.,Ltd.'s (SZSE:002992) 30% Price Boost Is Out Of Tune With Revenues
Those holding Shenzhen Baoming Technology Co.,Ltd. (SZSE:002992) shares would be relieved that the share price has rebounded 30% in the last thirty days, but it needs to keep going to repair the recent damage it has caused to investor portfolios. Looking further back, the 13% rise over the last twelve months isn't too bad notwithstanding the strength over the last 30 days.
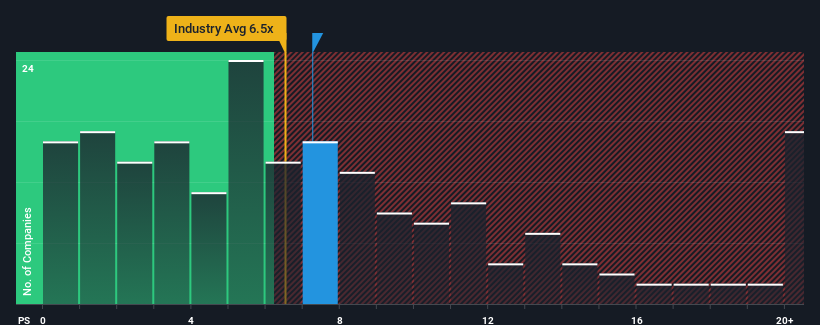
Even after such a large jump in price, it's still not a stretch to say that Shenzhen Baoming TechnologyLtd's price-to-sales (or "P/S") ratio of 7.3x right now seems quite "middle-of-the-road" compared to the Semiconductor industry in China, where the median P/S ratio is around 6.5x. However, investors might be overlooking a clear opportunity or potential setback if there is no rational basis for the P/S.
View our latest analysis for Shenzhen Baoming TechnologyLtd
How Has Shenzhen Baoming TechnologyLtd Performed Recently?
Recent times have been advantageous for Shenzhen Baoming TechnologyLtd as its revenues have been rising faster than most other companies. It might be that many expect the strong revenue performance to wane, which has kept the P/S ratio from rising. If you like the company, you'd be hoping this isn't the case so that you could potentially pick up some stock while it's not quite in favour.
If you'd like to see what analysts are forecasting going forward, you should check out our free report on Shenzhen Baoming TechnologyLtd.How Is Shenzhen Baoming TechnologyLtd's Revenue Growth Trending?
In order to justify its P/S ratio, Shenzhen Baoming TechnologyLtd would need to produce growth that's similar to the industry.
If we review the last year of revenue growth, the company posted a terrific increase of 25%. However, this wasn't enough as the latest three year period has seen the company endure a nasty 11% drop in revenue in aggregate. Accordingly, shareholders would have felt downbeat about the medium-term rates of revenue growth.
Looking ahead now, revenue is anticipated to climb by 31% during the coming year according to the one analyst following the company. That's shaping up to be materially lower than the 37% growth forecast for the broader industry.
In light of this, it's curious that Shenzhen Baoming TechnologyLtd's P/S sits in line with the majority of other companies. Apparently many investors in the company are less bearish than analysts indicate and aren't willing to let go of their stock right now. Maintaining these prices will be difficult to achieve as this level of revenue growth is likely to weigh down the shares eventually.
The Bottom Line On Shenzhen Baoming TechnologyLtd's P/S
Shenzhen Baoming TechnologyLtd appears to be back in favour with a solid price jump bringing its P/S back in line with other companies in the industry While the price-to-sales ratio shouldn't be the defining factor in whether you buy a stock or not, it's quite a capable barometer of revenue expectations.
When you consider that Shenzhen Baoming TechnologyLtd's revenue growth estimates are fairly muted compared to the broader industry, it's easy to see why we consider it unexpected to be trading at its current P/S ratio. At present, we aren't confident in the P/S as the predicted future revenues aren't likely to support a more positive sentiment for long. A positive change is needed in order to justify the current price-to-sales ratio.
It is also worth noting that we have found 1 warning sign for Shenzhen Baoming TechnologyLtd that you need to take into consideration.
Of course, profitable companies with a history of great earnings growth are generally safer bets. So you may wish to see this free collection of other companies that have reasonable P/E ratios and have grown earnings strongly.
New: Manage All Your Stock Portfolios in One Place
We've created the ultimate portfolio companion for stock investors, and it's free.
• Connect an unlimited number of Portfolios and see your total in one currency
• Be alerted to new Warning Signs or Risks via email or mobile
• Track the Fair Value of your stocks
Have feedback on this article? Concerned about the content? Get in touch with us directly. Alternatively, email editorial-team (at) simplywallst.com.
This article by Simply Wall St is general in nature. We provide commentary based on historical data and analyst forecasts only using an unbiased methodology and our articles are not intended to be financial advice. It does not constitute a recommendation to buy or sell any stock, and does not take account of your objectives, or your financial situation. We aim to bring you long-term focused analysis driven by fundamental data. Note that our analysis may not factor in the latest price-sensitive company announcements or qualitative material. Simply Wall St has no position in any stocks mentioned.
About SZSE:002992
Shenzhen Baoming TechnologyLtd
Engages in the research and development, design, production, and sale of flat panel display devices in China.
Mediocre balance sheet and overvalued.
Similar Companies
Market Insights

Advertisement
Community Narratives
MicroVision will explode future revenue by 380.37% with a vision towards success
Fair Value US$60|98.4% undervalued
TH
Community Contributor
The Indispensable Artery for a New North American Economy
Fair Value CA$132.87|0.7% overvalued
TI
Community Contributor
Recently Updated Narratives
CO

composite32 on Astor Enerji ·
Astor Enerji will surge with a fair value of $140.43 in the next 3 years
Fair Value:₺140.4335.5% undervalued
1 followerusers have followed this narrative
0 commentsusers have commented on this narrative
0 likesusers have liked this narrative
RE

RecMag on Proximus ·
Proximus: The State-Backed Backup Plan with 7% Gross Yield and 15% Currency Upside.
Fair Value:€17.1356.7% undervalued
30 followersusers have followed this narrative
0 commentsusers have commented on this narrative
0 likesusers have liked this narrative
AG


Agricola on IMPACT Silver ·
A case for for IMPACT Silver Corp (TSXV:IPT) to reach USD $4.52 (CAD $6.16) in 2026 (23 bagger in 1 year) and USD $5.76 (CAD $7.89) by 2030
Fair Value:CA$7.8996.2% undervalued
1 followerusers have followed this narrative
0 commentsusers have commented on this narrative
0 likesusers have liked this narrative
Popular Narratives
TH

TheWallstreetKing on MicroVision ·
MicroVision will explode future revenue by 380.37% with a vision towards success
Fair Value:US$6098.4% undervalued
101 followersusers have followed this narrative
10 commentsusers have commented on this narrative
20 likesusers have liked this narrative
OS


oscargarcia on Alphabet ·
The company that turned a verb into a global necessity and basically runs the modern internet, digital ads, smartphones, maps, and AI.
Fair Value:US$3405.8% undervalued
139 followersusers have followed this narrative
6 commentsusers have commented on this narrative
18 likesusers have liked this narrative
AN


AnalystConsensusTarget on NVIDIA ·
NVDA: Expanding AI Demand Will Drive Major Data Center Investments Through 2026
Fair Value:US$250.3929.3% undervalued
931 followersusers have followed this narrative
6 commentsusers have commented on this narrative
23 likesusers have liked this narrative