
Advertisement
- China
- /
- Semiconductors
- /
- SHSE:688798
Shanghai Awinic Technology Co.,Ltd.'s (SHSE:688798) 28% Price Boost Is Out Of Tune With Revenues
Shanghai Awinic Technology Co.,Ltd. (SHSE:688798) shareholders are no doubt pleased to see that the share price has bounced 28% in the last month, although it is still struggling to make up recently lost ground. Unfortunately, the gains of the last month did little to right the losses of the last year with the stock still down 23% over that time.
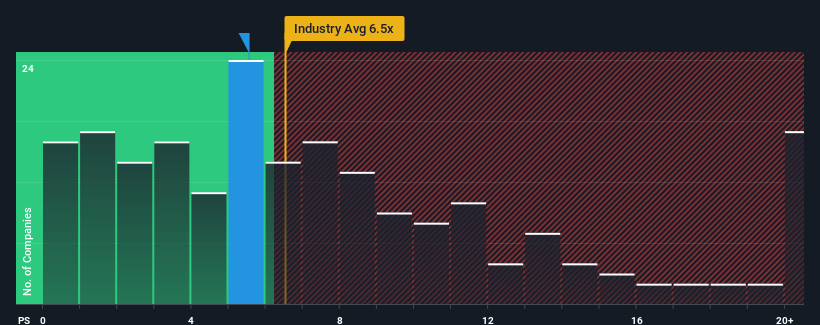
In spite of the firm bounce in price, there still wouldn't be many who think Shanghai Awinic TechnologyLtd's price-to-sales (or "P/S") ratio of 5.5x is worth a mention when the median P/S in China's Semiconductor industry is similar at about 6.5x. However, investors might be overlooking a clear opportunity or potential setback if there is no rational basis for the P/S.
See our latest analysis for Shanghai Awinic TechnologyLtd
What Does Shanghai Awinic TechnologyLtd's Recent Performance Look Like?
Shanghai Awinic TechnologyLtd's revenue growth of late has been pretty similar to most other companies. Perhaps the market is expecting future revenue performance to show no drastic signs of changing, justifying the P/S being at current levels. Those who are bullish on Shanghai Awinic TechnologyLtd will be hoping that revenue performance can pick up, so that they can pick up the stock at a slightly lower valuation.
If you'd like to see what analysts are forecasting going forward, you should check out our free report on Shanghai Awinic TechnologyLtd.What Are Revenue Growth Metrics Telling Us About The P/S?
The only time you'd be comfortable seeing a P/S like Shanghai Awinic TechnologyLtd's is when the company's growth is tracking the industry closely.
Retrospectively, the last year delivered an exceptional 21% gain to the company's top line. Pleasingly, revenue has also lifted 76% in aggregate from three years ago, thanks to the last 12 months of growth. Accordingly, shareholders would have definitely welcomed those medium-term rates of revenue growth.
Looking ahead now, revenue is anticipated to climb by 25% during the coming year according to the nine analysts following the company. Meanwhile, the rest of the industry is forecast to expand by 37%, which is noticeably more attractive.
With this information, we find it interesting that Shanghai Awinic TechnologyLtd is trading at a fairly similar P/S compared to the industry. Apparently many investors in the company are less bearish than analysts indicate and aren't willing to let go of their stock right now. Maintaining these prices will be difficult to achieve as this level of revenue growth is likely to weigh down the shares eventually.
The Key Takeaway
Shanghai Awinic TechnologyLtd's stock has a lot of momentum behind it lately, which has brought its P/S level with the rest of the industry. It's argued the price-to-sales ratio is an inferior measure of value within certain industries, but it can be a powerful business sentiment indicator.
When you consider that Shanghai Awinic TechnologyLtd's revenue growth estimates are fairly muted compared to the broader industry, it's easy to see why we consider it unexpected to be trading at its current P/S ratio. When we see companies with a relatively weaker revenue outlook compared to the industry, we suspect the share price is at risk of declining, sending the moderate P/S lower. A positive change is needed in order to justify the current price-to-sales ratio.
Having said that, be aware Shanghai Awinic TechnologyLtd is showing 1 warning sign in our investment analysis, you should know about.
If strong companies turning a profit tickle your fancy, then you'll want to check out this free list of interesting companies that trade on a low P/E (but have proven they can grow earnings).
New: Manage All Your Stock Portfolios in One Place
We've created the ultimate portfolio companion for stock investors, and it's free.
• Connect an unlimited number of Portfolios and see your total in one currency
• Be alerted to new Warning Signs or Risks via email or mobile
• Track the Fair Value of your stocks
Have feedback on this article? Concerned about the content? Get in touch with us directly. Alternatively, email editorial-team (at) simplywallst.com.
This article by Simply Wall St is general in nature. We provide commentary based on historical data and analyst forecasts only using an unbiased methodology and our articles are not intended to be financial advice. It does not constitute a recommendation to buy or sell any stock, and does not take account of your objectives, or your financial situation. We aim to bring you long-term focused analysis driven by fundamental data. Note that our analysis may not factor in the latest price-sensitive company announcements or qualitative material. Simply Wall St has no position in any stocks mentioned.
About SHSE:688798
Shanghai Awinic TechnologyLtd
Engages in the research, development, and sale of integrated circuit chips in China and internationally.
Flawless balance sheet with reasonable growth potential.
Market Insights

Advertisement
Community Narratives
MINISO's fair value is projected at 26.69 with an anticipated PE ratio shift of 20x
Fair Value US$24.03|11.0% undervalued
BE
Community Contributor
Procter & Gamble: A Dividend Giant Facing Slowing Growth
Fair Value US$119.81|23.3% overvalued
AN
Community Contributor
Eli Lilly's Future Growth Driven by Tirzepatide and Favorable Market Conditions
Fair Value US$1.19k|13.8% undervalued
EA
Community Contributor