
Advertisement
- China
- /
- Semiconductors
- /
- SHSE:688383
Here's What's Concerning About Shenzhen Xinyichang Technology's (SHSE:688383) Returns On Capital
If we want to find a stock that could multiply over the long term, what are the underlying trends we should look for? Amongst other things, we'll want to see two things; firstly, a growing return on capital employed (ROCE) and secondly, an expansion in the company's amount of capital employed. Put simply, these types of businesses are compounding machines, meaning they are continually reinvesting their earnings at ever-higher rates of return. However, after investigating Shenzhen Xinyichang Technology (SHSE:688383), we don't think it's current trends fit the mold of a multi-bagger.
Understanding Return On Capital Employed (ROCE)
If you haven't worked with ROCE before, it measures the 'return' (pre-tax profit) a company generates from capital employed in its business. To calculate this metric for Shenzhen Xinyichang Technology, this is the formula:
Return on Capital Employed = Earnings Before Interest and Tax (EBIT) ÷ (Total Assets - Current Liabilities)
0.033 = CN¥49m ÷ (CN¥2.6b - CN¥1.1b) (Based on the trailing twelve months to December 2023).
Therefore, Shenzhen Xinyichang Technology has an ROCE of 3.3%. In absolute terms, that's a low return and it also under-performs the Semiconductor industry average of 5.8%.
See our latest analysis for Shenzhen Xinyichang Technology
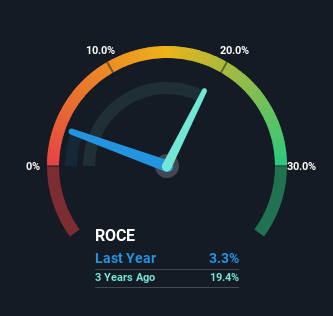
Above you can see how the current ROCE for Shenzhen Xinyichang Technology compares to its prior returns on capital, but there's only so much you can tell from the past. If you'd like to see what analysts are forecasting going forward, you should check out our free analyst report for Shenzhen Xinyichang Technology .
The Trend Of ROCE
In terms of Shenzhen Xinyichang Technology's historical ROCE movements, the trend isn't fantastic. To be more specific, ROCE has fallen from 23% over the last four years. Given the business is employing more capital while revenue has slipped, this is a bit concerning. If this were to continue, you might be looking at a company that is trying to reinvest for growth but is actually losing market share since sales haven't increased.
On a separate but related note, it's important to know that Shenzhen Xinyichang Technology has a current liabilities to total assets ratio of 43%, which we'd consider pretty high. This can bring about some risks because the company is basically operating with a rather large reliance on its suppliers or other sorts of short-term creditors. While it's not necessarily a bad thing, it can be beneficial if this ratio is lower.
The Key Takeaway
In summary, we're somewhat concerned by Shenzhen Xinyichang Technology's diminishing returns on increasing amounts of capital. It should come as no surprise then that the stock has fallen 32% over the last year, so it looks like investors are recognizing these changes. With underlying trends that aren't great in these areas, we'd consider looking elsewhere.
Since virtually every company faces some risks, it's worth knowing what they are, and we've spotted 2 warning signs for Shenzhen Xinyichang Technology (of which 1 is a bit concerning!) that you should know about.
While Shenzhen Xinyichang Technology may not currently earn the highest returns, we've compiled a list of companies that currently earn more than 25% return on equity. Check out this free list here.
New: Manage All Your Stock Portfolios in One Place
We've created the ultimate portfolio companion for stock investors, and it's free.
• Connect an unlimited number of Portfolios and see your total in one currency
• Be alerted to new Warning Signs or Risks via email or mobile
• Track the Fair Value of your stocks
Have feedback on this article? Concerned about the content? Get in touch with us directly. Alternatively, email editorial-team (at) simplywallst.com.
This article by Simply Wall St is general in nature. We provide commentary based on historical data and analyst forecasts only using an unbiased methodology and our articles are not intended to be financial advice. It does not constitute a recommendation to buy or sell any stock, and does not take account of your objectives, or your financial situation. We aim to bring you long-term focused analysis driven by fundamental data. Note that our analysis may not factor in the latest price-sensitive company announcements or qualitative material. Simply Wall St has no position in any stocks mentioned.
About SHSE:688383
Shenzhen Xinyichang Technology
Engages in the research and development, production, and sale of intelligent manufacturing equipment for LED, capacitor, semiconductor, lithium battery, and other industries in China.
High growth potential with imperfect balance sheet.
Market Insights

Advertisement
Community Narratives
Finding The True Value Of A Logistics Powerhouse
Fair Value US$95.21|6.3% undervalued
NV
Community Contributor
Paradigm Biopharmaceuticals Will Lead Osteoarthritis Treatment with Zilosul's FDA Success
Fair Value AU$5.50|91.9% undervalued
AM
Community Contributor
Barrick Mining (ABX:CA): A Gold Hedge against a U.S. Shutdown
Fair Value CA$60.00|25.8% undervalued
GM
Community Contributor