
Advertisement
- China
- /
- Semiconductors
- /
- SHSE:688107
Shanghai Anlogic Infotech Co., Ltd.'s (SHSE:688107) Popularity With Investors Is Under Threat From Overpricing
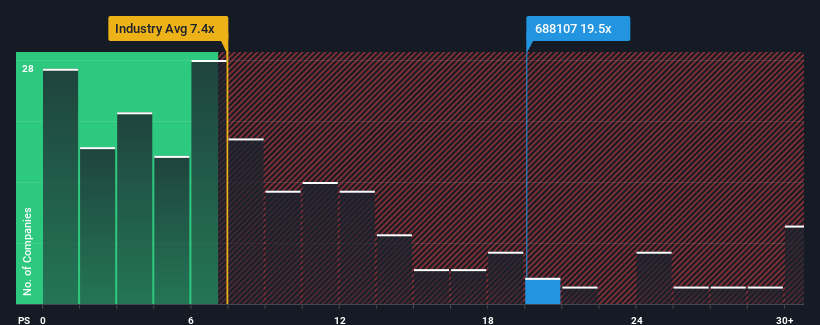
You may think that with a price-to-sales (or "P/S") ratio of 19.5x Shanghai Anlogic Infotech Co., Ltd. (SHSE:688107) is a stock to avoid completely, seeing as almost half of all the Semiconductor companies in China have P/S ratios under 7.4x and even P/S lower than 3x aren't out of the ordinary. Nonetheless, we'd need to dig a little deeper to determine if there is a rational basis for the highly elevated P/S.
See our latest analysis for Shanghai Anlogic Infotech
What Does Shanghai Anlogic Infotech's P/S Mean For Shareholders?
While the industry has experienced revenue growth lately, Shanghai Anlogic Infotech's revenue has gone into reverse gear, which is not great. One possibility is that the P/S ratio is high because investors think this poor revenue performance will turn the corner. If not, then existing shareholders may be extremely nervous about the viability of the share price.
If you'd like to see what analysts are forecasting going forward, you should check out our free report on Shanghai Anlogic Infotech.How Is Shanghai Anlogic Infotech's Revenue Growth Trending?
In order to justify its P/S ratio, Shanghai Anlogic Infotech would need to produce outstanding growth that's well in excess of the industry.
In reviewing the last year of financials, we were disheartened to see the company's revenues fell to the tune of 28%. That put a dampener on the good run it was having over the longer-term as its three-year revenue growth is still a noteworthy 12% in total. Although it's been a bumpy ride, it's still fair to say the revenue growth recently has been mostly respectable for the company.
Turning to the outlook, the next year should generate growth of 45% as estimated by the four analysts watching the company. That's shaping up to be similar to the 50% growth forecast for the broader industry.
With this in consideration, we find it intriguing that Shanghai Anlogic Infotech's P/S is higher than its industry peers. It seems most investors are ignoring the fairly average growth expectations and are willing to pay up for exposure to the stock. These shareholders may be setting themselves up for disappointment if the P/S falls to levels more in line with the growth outlook.
The Final Word
We'd say the price-to-sales ratio's power isn't primarily as a valuation instrument but rather to gauge current investor sentiment and future expectations.
Analysts are forecasting Shanghai Anlogic Infotech's revenues to only grow on par with the rest of the industry, which has lead to the high P/S ratio being unexpected. When we see revenue growth that just matches the industry, we don't expect elevates P/S figures to remain inflated for the long-term. Unless the company can jump ahead of the rest of the industry in the short-term, it'll be a challenge to maintain the share price at current levels.
You always need to take note of risks, for example - Shanghai Anlogic Infotech has 1 warning sign we think you should be aware of.
It's important to make sure you look for a great company, not just the first idea you come across. So if growing profitability aligns with your idea of a great company, take a peek at this free list of interesting companies with strong recent earnings growth (and a low P/E).
New: Manage All Your Stock Portfolios in One Place
We've created the ultimate portfolio companion for stock investors, and it's free.
• Connect an unlimited number of Portfolios and see your total in one currency
• Be alerted to new Warning Signs or Risks via email or mobile
• Track the Fair Value of your stocks
Have feedback on this article? Concerned about the content? Get in touch with us directly. Alternatively, email editorial-team (at) simplywallst.com.
This article by Simply Wall St is general in nature. We provide commentary based on historical data and analyst forecasts only using an unbiased methodology and our articles are not intended to be financial advice. It does not constitute a recommendation to buy or sell any stock, and does not take account of your objectives, or your financial situation. We aim to bring you long-term focused analysis driven by fundamental data. Note that our analysis may not factor in the latest price-sensitive company announcements or qualitative material. Simply Wall St has no position in any stocks mentioned.
About SHSE:688107
Shanghai Anlogic Infotech
Provides programmable logic device chips and software development supporting tools in China.
Flawless balance sheet with limited growth.
Market Insights

Advertisement
Community Narratives
MINISO's fair value is projected at 26.69 with an anticipated PE ratio shift of 20x
Fair Value US$24.03|11.0% undervalued
BE
Community Contributor
Procter & Gamble: A Dividend Giant Facing Slowing Growth
Fair Value US$119.81|23.3% overvalued
AN
Community Contributor
Eli Lilly's Future Growth Driven by Tirzepatide and Favorable Market Conditions
Fair Value US$1.19k|13.8% undervalued
EA
Community Contributor