
Advertisement
Some say volatility, rather than debt, is the best way to think about risk as an investor, but Warren Buffett famously said that 'Volatility is far from synonymous with risk.' When we think about how risky a company is, we always like to look at its use of debt, since debt overload can lead to ruin. We note that JCET Group Co., Ltd. (SHSE:600584) does have debt on its balance sheet. But the real question is whether this debt is making the company risky.
What Risk Does Debt Bring?
Debt and other liabilities become risky for a business when it cannot easily fulfill those obligations, either with free cash flow or by raising capital at an attractive price. In the worst case scenario, a company can go bankrupt if it cannot pay its creditors. However, a more frequent (but still costly) occurrence is where a company must issue shares at bargain-basement prices, permanently diluting shareholders, just to shore up its balance sheet. Of course, plenty of companies use debt to fund growth, without any negative consequences. The first thing to do when considering how much debt a business uses is to look at its cash and debt together.
Check out our latest analysis for JCET Group
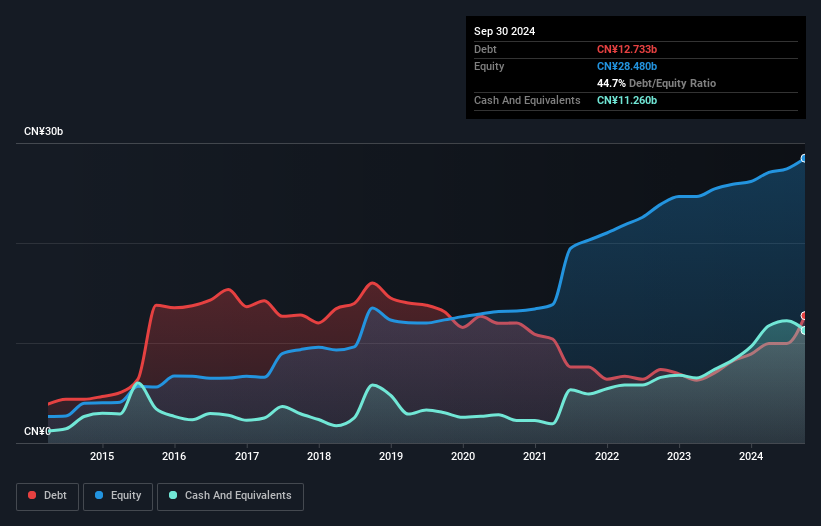
How Much Debt Does JCET Group Carry?
As you can see below, at the end of September 2024, JCET Group had CN¥12.7b of debt, up from CN¥8.22b a year ago. Click the image for more detail. However, it does have CN¥11.3b in cash offsetting this, leading to net debt of about CN¥1.47b.
How Healthy Is JCET Group's Balance Sheet?
We can see from the most recent balance sheet that JCET Group had liabilities of CN¥15.6b falling due within a year, and liabilities of CN¥9.53b due beyond that. Offsetting this, it had CN¥11.3b in cash and CN¥6.07b in receivables that were due within 12 months. So its liabilities outweigh the sum of its cash and (near-term) receivables by CN¥7.81b.
Of course, JCET Group has a market capitalization of CN¥72.0b, so these liabilities are probably manageable. Having said that, it's clear that we should continue to monitor its balance sheet, lest it change for the worse.
We measure a company's debt load relative to its earnings power by looking at its net debt divided by its earnings before interest, tax, depreciation, and amortization (EBITDA) and by calculating how easily its earnings before interest and tax (EBIT) cover its interest expense (interest cover). The advantage of this approach is that we take into account both the absolute quantum of debt (with net debt to EBITDA) and the actual interest expenses associated with that debt (with its interest cover ratio).
JCET Group has a low net debt to EBITDA ratio of only 0.29. And its EBIT covers its interest expense a whopping 12.5 times over. So we're pretty relaxed about its super-conservative use of debt. And we also note warmly that JCET Group grew its EBIT by 14% last year, making its debt load easier to handle. There's no doubt that we learn most about debt from the balance sheet. But it is future earnings, more than anything, that will determine JCET Group's ability to maintain a healthy balance sheet going forward. So if you want to see what the professionals think, you might find this free report on analyst profit forecasts to be interesting.
Finally, a company can only pay off debt with cold hard cash, not accounting profits. So we clearly need to look at whether that EBIT is leading to corresponding free cash flow. Over the last three years, JCET Group recorded free cash flow worth a fulsome 82% of its EBIT, which is stronger than we'd usually expect. That positions it well to pay down debt if desirable to do so.
Our View
Happily, JCET Group's impressive interest cover implies it has the upper hand on its debt. And the good news does not stop there, as its conversion of EBIT to free cash flow also supports that impression! Considering this range of factors, it seems to us that JCET Group is quite prudent with its debt, and the risks seem well managed. So the balance sheet looks pretty healthy, to us. Over time, share prices tend to follow earnings per share, so if you're interested in JCET Group, you may well want to click here to check an interactive graph of its earnings per share history.
If, after all that, you're more interested in a fast growing company with a rock-solid balance sheet, then check out our list of net cash growth stocks without delay.
New: Manage All Your Stock Portfolios in One Place
We've created the ultimate portfolio companion for stock investors, and it's free.
• Connect an unlimited number of Portfolios and see your total in one currency
• Be alerted to new Warning Signs or Risks via email or mobile
• Track the Fair Value of your stocks
Have feedback on this article? Concerned about the content? Get in touch with us directly. Alternatively, email editorial-team (at) simplywallst.com.
This article by Simply Wall St is general in nature. We provide commentary based on historical data and analyst forecasts only using an unbiased methodology and our articles are not intended to be financial advice. It does not constitute a recommendation to buy or sell any stock, and does not take account of your objectives, or your financial situation. We aim to bring you long-term focused analysis driven by fundamental data. Note that our analysis may not factor in the latest price-sensitive company announcements or qualitative material. Simply Wall St has no position in any stocks mentioned.
About SHSE:600584
JCET Group
Provides integrated-circuit manufacturing and technology services in China and internationally.
Flawless balance sheet and undervalued.
Similar Companies
Market Insights

Advertisement
Community Narratives
MINISO's fair value is projected at 26.69 with an anticipated PE ratio shift of 20x
Fair Value US$24.03|11.0% undervalued
BE
Community Contributor
Procter & Gamble: A Dividend Giant Facing Slowing Growth
Fair Value US$119.81|23.3% overvalued
AN
Community Contributor
Eli Lilly's Future Growth Driven by Tirzepatide and Favorable Market Conditions
Fair Value US$1.19k|13.8% undervalued
EA
Community Contributor