
Advertisement
- China
- /
- Retail Distributors
- /
- SHSE:600704
Wuchan Zhongda GroupLtd (SHSE:600704) Might Be Having Difficulty Using Its Capital Effectively
If we want to find a potential multi-bagger, often there are underlying trends that can provide clues. Firstly, we'll want to see a proven return on capital employed (ROCE) that is increasing, and secondly, an expanding base of capital employed. This shows us that it's a compounding machine, able to continually reinvest its earnings back into the business and generate higher returns. Having said that, from a first glance at Wuchan Zhongda GroupLtd (SHSE:600704) we aren't jumping out of our chairs at how returns are trending, but let's have a deeper look.
Return On Capital Employed (ROCE): What Is It?
For those that aren't sure what ROCE is, it measures the amount of pre-tax profits a company can generate from the capital employed in its business. Analysts use this formula to calculate it for Wuchan Zhongda GroupLtd:
Return on Capital Employed = Earnings Before Interest and Tax (EBIT) ÷ (Total Assets - Current Liabilities)
0.077 = CN¥5.5b ÷ (CN¥204b - CN¥133b) (Based on the trailing twelve months to March 2024).
Thus, Wuchan Zhongda GroupLtd has an ROCE of 7.7%. In absolute terms, that's a low return, but it's much better than the Retail Distributors industry average of 5.6%.
Check out our latest analysis for Wuchan Zhongda GroupLtd
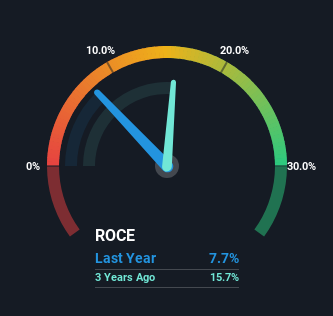
Historical performance is a great place to start when researching a stock so above you can see the gauge for Wuchan Zhongda GroupLtd's ROCE against it's prior returns. If you want to delve into the historical earnings , check out these free graphs detailing revenue and cash flow performance of Wuchan Zhongda GroupLtd.
What Can We Tell From Wuchan Zhongda GroupLtd's ROCE Trend?
On the surface, the trend of ROCE at Wuchan Zhongda GroupLtd doesn't inspire confidence. Over the last five years, returns on capital have decreased to 7.7% from 10% five years ago. On the other hand, the company has been employing more capital without a corresponding improvement in sales in the last year, which could suggest these investments are longer term plays. It may take some time before the company starts to see any change in earnings from these investments.
On a separate but related note, it's important to know that Wuchan Zhongda GroupLtd has a current liabilities to total assets ratio of 65%, which we'd consider pretty high. This effectively means that suppliers (or short-term creditors) are funding a large portion of the business, so just be aware that this can introduce some elements of risk. While it's not necessarily a bad thing, it can be beneficial if this ratio is lower.
The Bottom Line On Wuchan Zhongda GroupLtd's ROCE
Bringing it all together, while we're somewhat encouraged by Wuchan Zhongda GroupLtd's reinvestment in its own business, we're aware that returns are shrinking. Additionally, the stock's total return to shareholders over the last five years has been flat, which isn't too surprising. In any case, the stock doesn't have these traits of a multi-bagger discussed above, so if that's what you're looking for, we think you'd have more luck elsewhere.
If you want to know some of the risks facing Wuchan Zhongda GroupLtd we've found 3 warning signs (2 can't be ignored!) that you should be aware of before investing here.
While Wuchan Zhongda GroupLtd isn't earning the highest return, check out this free list of companies that are earning high returns on equity with solid balance sheets.
Valuation is complex, but we're here to simplify it.
Discover if Wuchan Zhongda GroupLtd might be undervalued or overvalued with our detailed analysis, featuring fair value estimates, potential risks, dividends, insider trades, and its financial condition.
Access Free AnalysisHave feedback on this article? Concerned about the content? Get in touch with us directly. Alternatively, email editorial-team (at) simplywallst.com.
This article by Simply Wall St is general in nature. We provide commentary based on historical data and analyst forecasts only using an unbiased methodology and our articles are not intended to be financial advice. It does not constitute a recommendation to buy or sell any stock, and does not take account of your objectives, or your financial situation. We aim to bring you long-term focused analysis driven by fundamental data. Note that our analysis may not factor in the latest price-sensitive company announcements or qualitative material. Simply Wall St has no position in any stocks mentioned.
Have feedback on this article? Concerned about the content? Get in touch with us directly. Alternatively, email editorial-team@simplywallst.com
About SHSE:600704
Wuchan Zhongda GroupLtd
Provides bulk commodity supply chain integration services in China and internationally.
Proven track record with adequate balance sheet and pays a dividend.
Market Insights

Advertisement
Community Narratives
MINISO's fair value is projected at 26.69 with an anticipated PE ratio shift of 20x
Fair Value US$24.03|11.0% undervalued
BE
Community Contributor
Procter & Gamble: A Dividend Giant Facing Slowing Growth
Fair Value US$119.81|23.3% overvalued
AN
Community Contributor
Eli Lilly's Future Growth Driven by Tirzepatide and Favorable Market Conditions
Fair Value US$1.19k|13.8% undervalued
EA
Community Contributor