
Advertisement
- China
- /
- Real Estate
- /
- SZSE:002133
Take Care Before Jumping Onto Cosmos Group Co., Ltd. (SZSE:002133) Even Though It's 25% Cheaper
Cosmos Group Co., Ltd. (SZSE:002133) shares have had a horrible month, losing 25% after a relatively good period beforehand. Instead of being rewarded, shareholders who have already held through the last twelve months are now sitting on a 33% share price drop.
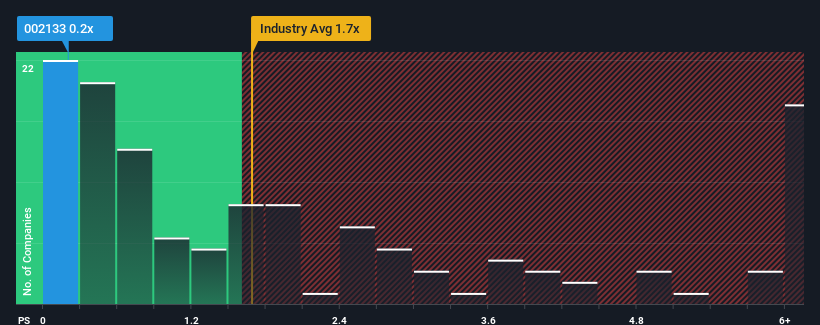
Since its price has dipped substantially, Cosmos Group may be sending buy signals at present with its price-to-sales (or "P/S") ratio of 0.2x, considering almost half of all companies in the Real Estate industry in China have P/S ratios greater than 1.7x and even P/S higher than 4x aren't out of the ordinary. Although, it's not wise to just take the P/S at face value as there may be an explanation why it's limited.
Check out our latest analysis for Cosmos Group
What Does Cosmos Group's P/S Mean For Shareholders?
With revenue growth that's exceedingly strong of late, Cosmos Group has been doing very well. Perhaps the market is expecting future revenue performance to dwindle, which has kept the P/S suppressed. If that doesn't eventuate, then existing shareholders have reason to be quite optimistic about the future direction of the share price.
Want the full picture on earnings, revenue and cash flow for the company? Then our free report on Cosmos Group will help you shine a light on its historical performance.How Is Cosmos Group's Revenue Growth Trending?
Cosmos Group's P/S ratio would be typical for a company that's only expected to deliver limited growth, and importantly, perform worse than the industry.
Retrospectively, the last year delivered an exceptional 64% gain to the company's top line. The latest three year period has also seen an excellent 54% overall rise in revenue, aided by its short-term performance. Therefore, it's fair to say the revenue growth recently has been superb for the company.
Comparing that to the industry, which is only predicted to deliver 4.9% growth in the next 12 months, the company's momentum is stronger based on recent medium-term annualised revenue results.
With this in mind, we find it intriguing that Cosmos Group's P/S isn't as high compared to that of its industry peers. It looks like most investors are not convinced the company can maintain its recent growth rates.
What Does Cosmos Group's P/S Mean For Investors?
Cosmos Group's recently weak share price has pulled its P/S back below other Real Estate companies. Using the price-to-sales ratio alone to determine if you should sell your stock isn't sensible, however it can be a practical guide to the company's future prospects.
Our examination of Cosmos Group revealed its three-year revenue trends aren't boosting its P/S anywhere near as much as we would have predicted, given they look better than current industry expectations. When we see robust revenue growth that outpaces the industry, we presume that there are notable underlying risks to the company's future performance, which is exerting downward pressure on the P/S ratio. It appears many are indeed anticipating revenue instability, because the persistence of these recent medium-term conditions would normally provide a boost to the share price.
Before you take the next step, you should know about the 2 warning signs for Cosmos Group (1 is potentially serious!) that we have uncovered.
If these risks are making you reconsider your opinion on Cosmos Group, explore our interactive list of high quality stocks to get an idea of what else is out there.
New: AI Stock Screener & Alerts
Our new AI Stock Screener scans the market every day to uncover opportunities.
• Dividend Powerhouses (3%+ Yield)
• Undervalued Small Caps with Insider Buying
• High growth Tech and AI Companies
Or build your own from over 50 metrics.
Have feedback on this article? Concerned about the content? Get in touch with us directly. Alternatively, email editorial-team (at) simplywallst.com.
This article by Simply Wall St is general in nature. We provide commentary based on historical data and analyst forecasts only using an unbiased methodology and our articles are not intended to be financial advice. It does not constitute a recommendation to buy or sell any stock, and does not take account of your objectives, or your financial situation. We aim to bring you long-term focused analysis driven by fundamental data. Note that our analysis may not factor in the latest price-sensitive company announcements or qualitative material. Simply Wall St has no position in any stocks mentioned.
Have feedback on this article? Concerned about the content? Get in touch with us directly. Alternatively, email editorial-team@simplywallst.com
About SZSE:002133
Cosmos Group
Engages in the real estate development and trading business in China.
Excellent balance sheet, good value and pays a dividend.
Market Insights

Advertisement
Community Narratives
The company that turned a verb into a global necessity and basically runs the modern internet, digital ads, smartphones, maps, and AI.
Fair Value US$300.00|6.3% undervalued
OS
Community Contributor
Flowers Foods Pays A Fair Price For Health
Fair Value US$16.12|26.0% undervalued
NV
Community Contributor
TMX Group will thrive with 33.3% profit margin and enduring market moat
Fair Value CA$49.90|3.7% overvalued
LI
Community Contributor