- China
- /
- Real Estate
- /
- SZSE:000926
There's No Escaping Hubei Fuxing Science and Technology Co.,Ltd's (SZSE:000926) Muted Revenues Despite A 28% Share Price Rise

Hubei Fuxing Science and Technology Co.,Ltd (SZSE:000926) shareholders would be excited to see that the share price has had a great month, posting a 28% gain and recovering from prior weakness. Unfortunately, the gains of the last month did little to right the losses of the last year with the stock still down 21% over that time.
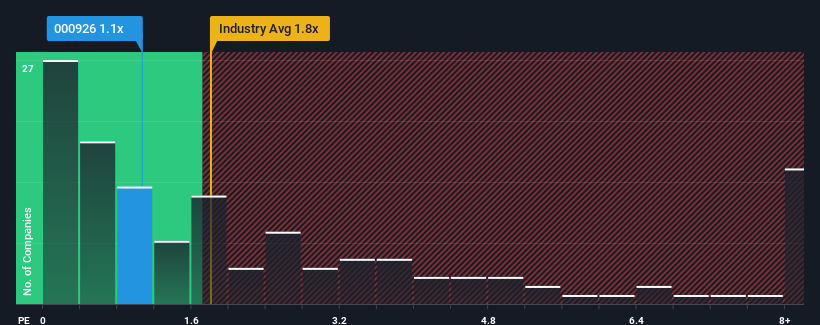
Although its price has surged higher, Hubei Fuxing Science and TechnologyLtd may still be sending bullish signals at the moment with its price-to-sales (or "P/S") ratio of 1.1x, since almost half of all companies in the Real Estate industry in China have P/S ratios greater than 1.8x and even P/S higher than 4x are not unusual. However, the P/S might be low for a reason and it requires further investigation to determine if it's justified.
Check out our latest analysis for Hubei Fuxing Science and TechnologyLtd
What Does Hubei Fuxing Science and TechnologyLtd's P/S Mean For Shareholders?
As an illustration, revenue has deteriorated at Hubei Fuxing Science and TechnologyLtd over the last year, which is not ideal at all. It might be that many expect the disappointing revenue performance to continue or accelerate, which has repressed the P/S. However, if this doesn't eventuate then existing shareholders may be feeling optimistic about the future direction of the share price.
Although there are no analyst estimates available for Hubei Fuxing Science and TechnologyLtd, take a look at this free data-rich visualisation to see how the company stacks up on earnings, revenue and cash flow.Do Revenue Forecasts Match The Low P/S Ratio?
There's an inherent assumption that a company should underperform the industry for P/S ratios like Hubei Fuxing Science and TechnologyLtd's to be considered reasonable.
Retrospectively, the last year delivered a frustrating 64% decrease to the company's top line. The last three years don't look nice either as the company has shrunk revenue by 50% in aggregate. Accordingly, shareholders would have felt downbeat about the medium-term rates of revenue growth.
Weighing that medium-term revenue trajectory against the broader industry's one-year forecast for expansion of 11% shows it's an unpleasant look.
With this in mind, we understand why Hubei Fuxing Science and TechnologyLtd's P/S is lower than most of its industry peers. Nonetheless, there's no guarantee the P/S has reached a floor yet with revenue going in reverse. Even just maintaining these prices could be difficult to achieve as recent revenue trends are already weighing down the shares.
What We Can Learn From Hubei Fuxing Science and TechnologyLtd's P/S?
Hubei Fuxing Science and TechnologyLtd's stock price has surged recently, but its but its P/S still remains modest. We'd say the price-to-sales ratio's power isn't primarily as a valuation instrument but rather to gauge current investor sentiment and future expectations.
It's no surprise that Hubei Fuxing Science and TechnologyLtd maintains its low P/S off the back of its sliding revenue over the medium-term. Right now shareholders are accepting the low P/S as they concede future revenue probably won't provide any pleasant surprises either. Unless the recent medium-term conditions improve, they will continue to form a barrier for the share price around these levels.
You need to take note of risks, for example - Hubei Fuxing Science and TechnologyLtd has 4 warning signs (and 2 which don't sit too well with us) we think you should know about.
Of course, profitable companies with a history of great earnings growth are generally safer bets. So you may wish to see this free collection of other companies that have reasonable P/E ratios and have grown earnings strongly.
Mobile Infrastructure for Defense and Disaster
The next wave in robotics isn't humanoid. Its fully autonomous towers delivering 5G, ISR, and radar in under 30 minutes, anywhere.
Get the investor briefing before the next round of contracts
Sponsored On Behalf of CiTechValuation is complex, but we're here to simplify it.
Discover if Hubei Fuxing Science and TechnologyLtd might be undervalued or overvalued with our detailed analysis, featuring fair value estimates, potential risks, dividends, insider trades, and its financial condition.
Access Free AnalysisHave feedback on this article? Concerned about the content? Get in touch with us directly. Alternatively, email editorial-team (at) simplywallst.com.
This article by Simply Wall St is general in nature. We provide commentary based on historical data and analyst forecasts only using an unbiased methodology and our articles are not intended to be financial advice. It does not constitute a recommendation to buy or sell any stock, and does not take account of your objectives, or your financial situation. We aim to bring you long-term focused analysis driven by fundamental data. Note that our analysis may not factor in the latest price-sensitive company announcements or qualitative material. Simply Wall St has no position in any stocks mentioned.
About SZSE:000926
Hubei Fuxing Science and TechnologyLtd
Engages in the real estate development business in China and internationally.
Mediocre balance sheet and slightly overvalued.
Market Insights

Weekly Picks

Early mover in a fast growing industry. Likely to experience share price volatility as they scale


A case for CA$31.80 (undiluted), aka 8,616% upside from CA$0.37 (an 86 bagger!).


Moderation and Stabilisation: HOLD: Fair Price based on a 4-year Cycle is $12.08
Recently Updated Narratives

Airbnb Stock: Platform Growth in a World of Saturation and Scrutiny

Clarivate Stock: When Data Becomes the Backbone of Innovation and Law

Adobe Stock: AI-Fueled ARR Growth Pushes Guidance Higher, But Cost Pressures Loom
Popular Narratives


Crazy Undervalued 42 Baggers Silver Play (Active & Running Mine)


NVDA: Expanding AI Demand Will Drive Major Data Center Investments Through 2026


MicroVision will explode future revenue by 380.37% with a vision towards success
Trending Discussion
