
Advertisement
- China
- /
- Real Estate
- /
- SHSE:603682
Lacklustre Performance Is Driving Shanghai Golden Union Commercial Management Co.,Ltd.'s (SHSE:603682) 26% Price Drop
The Shanghai Golden Union Commercial Management Co.,Ltd. (SHSE:603682) share price has fared very poorly over the last month, falling by a substantial 26%. The drop over the last 30 days has capped off a tough year for shareholders, with the share price down 20% in that time.
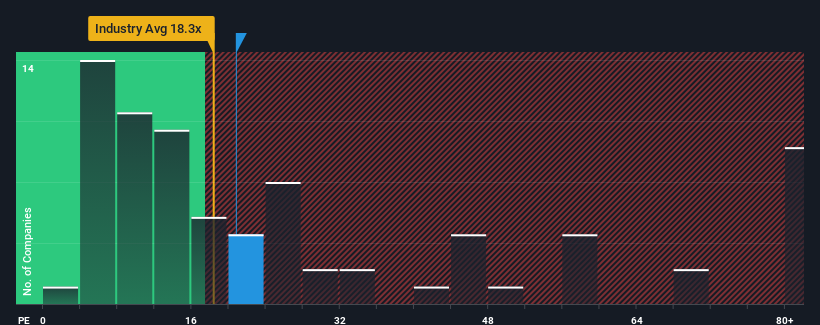
Although its price has dipped substantially, given about half the companies in China have price-to-earnings ratios (or "P/E's") above 30x, you may still consider Shanghai Golden Union Commercial ManagementLtd as an attractive investment with its 20.8x P/E ratio. Although, it's not wise to just take the P/E at face value as there may be an explanation why it's limited.
It looks like earnings growth has deserted Shanghai Golden Union Commercial ManagementLtd recently, which is not something to boast about. It might be that many expect the uninspiring earnings performance to worsen, which has repressed the P/E. If you like the company, you'd be hoping this isn't the case so that you could potentially pick up some stock while it's out of favour.
Check out our latest analysis for Shanghai Golden Union Commercial ManagementLtd
How Is Shanghai Golden Union Commercial ManagementLtd's Growth Trending?
There's an inherent assumption that a company should underperform the market for P/E ratios like Shanghai Golden Union Commercial ManagementLtd's to be considered reasonable.
Retrospectively, the last year delivered virtually the same number to the company's bottom line as the year before. Whilst it's an improvement, it wasn't enough to get the company out of the hole it was in, with earnings down 44% overall from three years ago. Therefore, it's fair to say the earnings growth recently has been undesirable for the company.
In contrast to the company, the rest of the market is expected to grow by 41% over the next year, which really puts the company's recent medium-term earnings decline into perspective.
In light of this, it's understandable that Shanghai Golden Union Commercial ManagementLtd's P/E would sit below the majority of other companies. Nonetheless, there's no guarantee the P/E has reached a floor yet with earnings going in reverse. There's potential for the P/E to fall to even lower levels if the company doesn't improve its profitability.
The Key Takeaway
Shanghai Golden Union Commercial ManagementLtd's P/E has taken a tumble along with its share price. It's argued the price-to-earnings ratio is an inferior measure of value within certain industries, but it can be a powerful business sentiment indicator.
We've established that Shanghai Golden Union Commercial ManagementLtd maintains its low P/E on the weakness of its sliding earnings over the medium-term, as expected. At this stage investors feel the potential for an improvement in earnings isn't great enough to justify a higher P/E ratio. Unless the recent medium-term conditions improve, they will continue to form a barrier for the share price around these levels.
We don't want to rain on the parade too much, but we did also find 4 warning signs for Shanghai Golden Union Commercial ManagementLtd (1 is significant!) that you need to be mindful of.
It's important to make sure you look for a great company, not just the first idea you come across. So take a peek at this free list of interesting companies with strong recent earnings growth (and a low P/E).
New: Manage All Your Stock Portfolios in One Place
We've created the ultimate portfolio companion for stock investors, and it's free.
• Connect an unlimited number of Portfolios and see your total in one currency
• Be alerted to new Warning Signs or Risks via email or mobile
• Track the Fair Value of your stocks
Have feedback on this article? Concerned about the content? Get in touch with us directly. Alternatively, email editorial-team (at) simplywallst.com.
This article by Simply Wall St is general in nature. We provide commentary based on historical data and analyst forecasts only using an unbiased methodology and our articles are not intended to be financial advice. It does not constitute a recommendation to buy or sell any stock, and does not take account of your objectives, or your financial situation. We aim to bring you long-term focused analysis driven by fundamental data. Note that our analysis may not factor in the latest price-sensitive company announcements or qualitative material. Simply Wall St has no position in any stocks mentioned.
About SHSE:603682
Shanghai Golden Union Commercial ManagementLtd
Shanghai Golden Union Commercial Management Co.,Ltd.
Adequate balance sheet and fair value.
Market Insights

Advertisement
Community Narratives
MINISO's fair value is projected at 26.69 with an anticipated PE ratio shift of 20x
Fair Value US$24.03|11.0% undervalued
BE
Community Contributor
Procter & Gamble: A Dividend Giant Facing Slowing Growth
Fair Value US$119.81|23.3% overvalued
AN
Community Contributor
Eli Lilly's Future Growth Driven by Tirzepatide and Favorable Market Conditions
Fair Value US$1.19k|13.8% undervalued
EA
Community Contributor