
Advertisement
- China
- /
- Real Estate
- /
- SHSE:600748
Shanghai Industrial Development Co.,Ltd (SHSE:600748) Stock Catapults 39% Though Its Price And Business Still Lag The Industry
The Shanghai Industrial Development Co.,Ltd (SHSE:600748) share price has done very well over the last month, posting an excellent gain of 39%. Not all shareholders will be feeling jubilant, since the share price is still down a very disappointing 12% in the last twelve months.
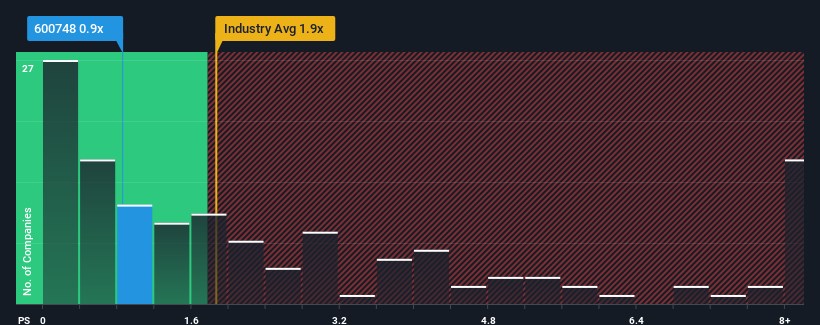
Even after such a large jump in price, Shanghai Industrial DevelopmentLtd's price-to-sales (or "P/S") ratio of 0.9x might still make it look like a buy right now compared to the Real Estate industry in China, where around half of the companies have P/S ratios above 1.9x and even P/S above 5x are quite common. Nonetheless, we'd need to dig a little deeper to determine if there is a rational basis for the reduced P/S.
Check out our latest analysis for Shanghai Industrial DevelopmentLtd
How Shanghai Industrial DevelopmentLtd Has Been Performing
It looks like revenue growth has deserted Shanghai Industrial DevelopmentLtd recently, which is not something to boast about. One possibility is that the P/S is low because investors think this benign revenue growth rate will likely underperform the broader industry in the near future. If not, then existing shareholders may be feeling optimistic about the future direction of the share price.
We don't have analyst forecasts, but you can see how recent trends are setting up the company for the future by checking out our free report on Shanghai Industrial DevelopmentLtd's earnings, revenue and cash flow.Is There Any Revenue Growth Forecasted For Shanghai Industrial DevelopmentLtd?
There's an inherent assumption that a company should underperform the industry for P/S ratios like Shanghai Industrial DevelopmentLtd's to be considered reasonable.
Taking a look back first, we see that there was hardly any revenue growth to speak of for the company over the past year. Regardless, revenue has managed to lift by a handy 9.4% in aggregate from three years ago, thanks to the earlier period of growth. Therefore, it's fair to say that revenue growth has been inconsistent recently for the company.
Comparing that to the industry, which is predicted to deliver 11% growth in the next 12 months, the company's momentum is weaker, based on recent medium-term annualised revenue results.
With this in consideration, it's easy to understand why Shanghai Industrial DevelopmentLtd's P/S falls short of the mark set by its industry peers. It seems most investors are expecting to see the recent limited growth rates continue into the future and are only willing to pay a reduced amount for the stock.
The Key Takeaway
The latest share price surge wasn't enough to lift Shanghai Industrial DevelopmentLtd's P/S close to the industry median. While the price-to-sales ratio shouldn't be the defining factor in whether you buy a stock or not, it's quite a capable barometer of revenue expectations.
In line with expectations, Shanghai Industrial DevelopmentLtd maintains its low P/S on the weakness of its recent three-year growth being lower than the wider industry forecast. At this stage investors feel the potential for an improvement in revenue isn't great enough to justify a higher P/S ratio. If recent medium-term revenue trends continue, it's hard to see the share price experience a reversal of fortunes anytime soon.
There are also other vital risk factors to consider before investing and we've discovered 2 warning signs for Shanghai Industrial DevelopmentLtd that you should be aware of.
If you're unsure about the strength of Shanghai Industrial DevelopmentLtd's business, why not explore our interactive list of stocks with solid business fundamentals for some other companies you may have missed.
New: Manage All Your Stock Portfolios in One Place
We've created the ultimate portfolio companion for stock investors, and it's free.
• Connect an unlimited number of Portfolios and see your total in one currency
• Be alerted to new Warning Signs or Risks via email or mobile
• Track the Fair Value of your stocks
Have feedback on this article? Concerned about the content? Get in touch with us directly. Alternatively, email editorial-team (at) simplywallst.com.
This article by Simply Wall St is general in nature. We provide commentary based on historical data and analyst forecasts only using an unbiased methodology and our articles are not intended to be financial advice. It does not constitute a recommendation to buy or sell any stock, and does not take account of your objectives, or your financial situation. We aim to bring you long-term focused analysis driven by fundamental data. Note that our analysis may not factor in the latest price-sensitive company announcements or qualitative material. Simply Wall St has no position in any stocks mentioned.
About SHSE:600748
Shanghai Industrial DevelopmentLtd
Develops, operates, sells, and manages real estate properties in China.
Mediocre balance sheet with low risk.
Market Insights

Advertisement
Community Narratives
MINISO's fair value is projected at 26.69 with an anticipated PE ratio shift of 20x
Fair Value US$24.03|12.0% undervalued
BE
Community Contributor
Procter & Gamble: A Dividend Giant Facing Slowing Growth
Fair Value US$119.81|21.7% overvalued
AN
Community Contributor
Eli Lilly's Future Growth Driven by Tirzepatide and Favorable Market Conditions
Fair Value US$1.19k|14.1% undervalued
EA
Community Contributor