
Advertisement
- China
- /
- Real Estate
- /
- SHSE:600692
Subdued Growth No Barrier To Shang Hai Ya Tong Co.,Ltd. (SHSE:600692) With Shares Advancing 26%
Shang Hai Ya Tong Co.,Ltd. (SHSE:600692) shares have had a really impressive month, gaining 26% after a shaky period beforehand. Unfortunately, despite the strong performance over the last month, the full year gain of 3.6% isn't as attractive.
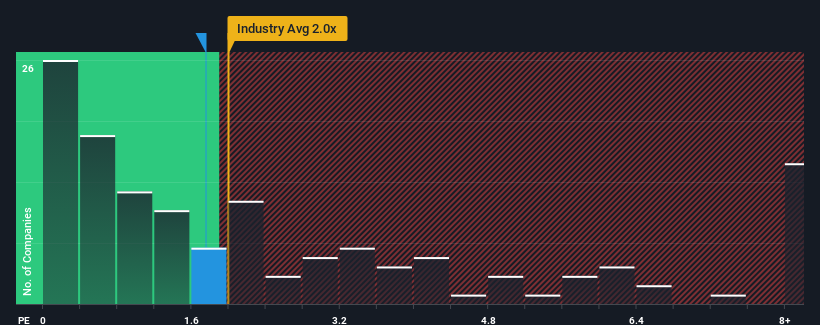
In spite of the firm bounce in price, it's still not a stretch to say that Shang Hai Ya TongLtd's price-to-sales (or "P/S") ratio of 1.8x right now seems quite "middle-of-the-road" compared to the Real Estate industry in China, where the median P/S ratio is around 2x. Although, it's not wise to simply ignore the P/S without explanation as investors may be disregarding a distinct opportunity or a costly mistake.
View our latest analysis for Shang Hai Ya TongLtd
What Does Shang Hai Ya TongLtd's P/S Mean For Shareholders?
For example, consider that Shang Hai Ya TongLtd's financial performance has been poor lately as its revenue has been in decline. One possibility is that the P/S is moderate because investors think the company might still do enough to be in line with the broader industry in the near future. If not, then existing shareholders may be a little nervous about the viability of the share price.
We don't have analyst forecasts, but you can see how recent trends are setting up the company for the future by checking out our free report on Shang Hai Ya TongLtd's earnings, revenue and cash flow.What Are Revenue Growth Metrics Telling Us About The P/S?
In order to justify its P/S ratio, Shang Hai Ya TongLtd would need to produce growth that's similar to the industry.
Retrospectively, the last year delivered a frustrating 7.5% decrease to the company's top line. This has erased any of its gains during the last three years, with practically no change in revenue being achieved in total. Accordingly, shareholders probably wouldn't have been overly satisfied with the unstable medium-term growth rates.
Weighing that medium-term revenue trajectory against the broader industry's one-year forecast for expansion of 5.2% shows it's an unpleasant look.
With this in mind, we find it worrying that Shang Hai Ya TongLtd's P/S exceeds that of its industry peers. Apparently many investors in the company are way less bearish than recent times would indicate and aren't willing to let go of their stock right now. Only the boldest would assume these prices are sustainable as a continuation of recent revenue trends is likely to weigh on the share price eventually.
The Final Word
Shang Hai Ya TongLtd appears to be back in favour with a solid price jump bringing its P/S back in line with other companies in the industry Generally, our preference is to limit the use of the price-to-sales ratio to establishing what the market thinks about the overall health of a company.
We find it unexpected that Shang Hai Ya TongLtd trades at a P/S ratio that is comparable to the rest of the industry, despite experiencing declining revenues during the medium-term, while the industry as a whole is expected to grow. Even though it matches the industry, we're uncomfortable with the current P/S ratio, as this dismal revenue performance is unlikely to support a more positive sentiment for long. If recent medium-term revenue trends continue, it will place shareholders' investments at risk and potential investors in danger of paying an unnecessary premium.
There are also other vital risk factors to consider and we've discovered 2 warning signs for Shang Hai Ya TongLtd (1 doesn't sit too well with us!) that you should be aware of before investing here.
If strong companies turning a profit tickle your fancy, then you'll want to check out this free list of interesting companies that trade on a low P/E (but have proven they can grow earnings).
New: Manage All Your Stock Portfolios in One Place
We've created the ultimate portfolio companion for stock investors, and it's free.
• Connect an unlimited number of Portfolios and see your total in one currency
• Be alerted to new Warning Signs or Risks via email or mobile
• Track the Fair Value of your stocks
Have feedback on this article? Concerned about the content? Get in touch with us directly. Alternatively, email editorial-team (at) simplywallst.com.
This article by Simply Wall St is general in nature. We provide commentary based on historical data and analyst forecasts only using an unbiased methodology and our articles are not intended to be financial advice. It does not constitute a recommendation to buy or sell any stock, and does not take account of your objectives, or your financial situation. We aim to bring you long-term focused analysis driven by fundamental data. Note that our analysis may not factor in the latest price-sensitive company announcements or qualitative material. Simply Wall St has no position in any stocks mentioned.
About SHSE:600692
Shang Hai Ya TongLtd
Engages in the real estate development business in China.
Excellent balance sheet and slightly overvalued.
Market Insights

Advertisement
Community Narratives
MINISO's fair value is projected at 26.69 with an anticipated PE ratio shift of 20x
Fair Value US$24.03|11.0% undervalued
BE
Community Contributor
Procter & Gamble: A Dividend Giant Facing Slowing Growth
Fair Value US$119.81|23.3% overvalued
AN
Community Contributor
Eli Lilly's Future Growth Driven by Tirzepatide and Favorable Market Conditions
Fair Value US$1.19k|13.8% undervalued
EA
Community Contributor