- China
- /
- Interactive Media and Services
- /
- SZSE:000681
Returns On Capital Signal Difficult Times Ahead For Visual China GroupLtd (SZSE:000681)

If we're looking to avoid a business that is in decline, what are the trends that can warn us ahead of time? Businesses in decline often have two underlying trends, firstly, a declining return on capital employed (ROCE) and a declining base of capital employed. This combination can tell you that not only is the company investing less, it's earning less on what it does invest. So after glancing at the trends within Visual China GroupLtd (SZSE:000681), we weren't too hopeful.
Understanding Return On Capital Employed (ROCE)
For those who don't know, ROCE is a measure of a company's yearly pre-tax profit (its return), relative to the capital employed in the business. Analysts use this formula to calculate it for Visual China GroupLtd:
Return on Capital Employed = Earnings Before Interest and Tax (EBIT) ÷ (Total Assets - Current Liabilities)
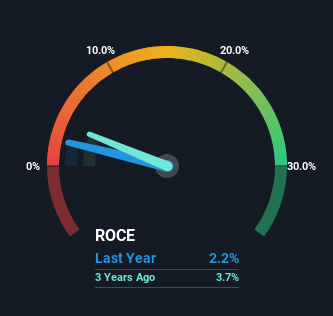
0.022 = CN¥84m ÷ (CN¥4.2b - CN¥469m) (Based on the trailing twelve months to September 2023).
Therefore, Visual China GroupLtd has an ROCE of 2.2%. Ultimately, that's a low return and it under-performs the Interactive Media and Services industry average of 5.5%.
View our latest analysis for Visual China GroupLtd
In the above chart we have measured Visual China GroupLtd's prior ROCE against its prior performance, but the future is arguably more important. If you'd like, you can check out the forecasts from the analysts covering Visual China GroupLtd for free.
What Does the ROCE Trend For Visual China GroupLtd Tell Us?
We are a bit worried about the trend of returns on capital at Visual China GroupLtd. About five years ago, returns on capital were 11%, however they're now substantially lower than that as we saw above. And on the capital employed front, the business is utilizing roughly the same amount of capital as it was back then. This combination can be indicative of a mature business that still has areas to deploy capital, but the returns received aren't as high due potentially to new competition or smaller margins. So because these trends aren't typically conducive to creating a multi-bagger, we wouldn't hold our breath on Visual China GroupLtd becoming one if things continue as they have.
In Conclusion...
All in all, the lower returns from the same amount of capital employed aren't exactly signs of a compounding machine. Investors haven't taken kindly to these developments, since the stock has declined 47% from where it was five years ago. Unless there is a shift to a more positive trajectory in these metrics, we would look elsewhere.
Visual China GroupLtd could be trading at an attractive price in other respects, so you might find our free intrinsic value estimation for 000681 on our platform quite valuable.
If you want to search for solid companies with great earnings, check out this free list of companies with good balance sheets and impressive returns on equity.
The New Payments ETF Is Live on NASDAQ:
Money is moving to real-time rails, and a newly listed ETF now gives investors direct exposure. Fast settlement. Institutional custody. Simple access.
Explore how this launch could reshape portfolios
Sponsored ContentNew: Manage All Your Stock Portfolios in One Place
We've created the ultimate portfolio companion for stock investors, and it's free.
• Connect an unlimited number of Portfolios and see your total in one currency
• Be alerted to new Warning Signs or Risks via email or mobile
• Track the Fair Value of your stocks
Have feedback on this article? Concerned about the content? Get in touch with us directly. Alternatively, email editorial-team (at) simplywallst.com.
This article by Simply Wall St is general in nature. We provide commentary based on historical data and analyst forecasts only using an unbiased methodology and our articles are not intended to be financial advice. It does not constitute a recommendation to buy or sell any stock, and does not take account of your objectives, or your financial situation. We aim to bring you long-term focused analysis driven by fundamental data. Note that our analysis may not factor in the latest price-sensitive company announcements or qualitative material. Simply Wall St has no position in any stocks mentioned.
About SZSE:000681
Visual China GroupLtd
Provides internet media and other services in China and internationally.
Flawless balance sheet with proven track record.
Similar Companies
Market Insights

Weekly Picks

Early mover in a fast growing industry. Likely to experience share price volatility as they scale


A case for CA$31.80 (undiluted), aka 8,616% upside from CA$0.37 (an 86 bagger!).


Moderation and Stabilisation: HOLD: Fair Price based on a 4-year Cycle is $12.08
Recently Updated Narratives

Airbnb Stock: Platform Growth in a World of Saturation and Scrutiny

Adobe Stock: AI-Fueled ARR Growth Pushes Guidance Higher, But Cost Pressures Loom

Thomson Reuters Stock: When Legal Intelligence Becomes Mission-Critical Infrastructure
Popular Narratives


Crazy Undervalued 42 Baggers Silver Play (Active & Running Mine)


NVDA: Expanding AI Demand Will Drive Major Data Center Investments Through 2026

The AI Infrastructure Giant Grows Into Its Valuation
Trending Discussion


