
Advertisement
- China
- /
- Interactive Media and Services
- /
- SZSE:000681
Earnings Not Telling The Story For Visual China Group Co.,Ltd. (SZSE:000681) After Shares Rise 28%
Visual China Group Co.,Ltd. (SZSE:000681) shareholders are no doubt pleased to see that the share price has bounced 28% in the last month, although it is still struggling to make up recently lost ground. Not all shareholders will be feeling jubilant, since the share price is still down a very disappointing 13% in the last twelve months.
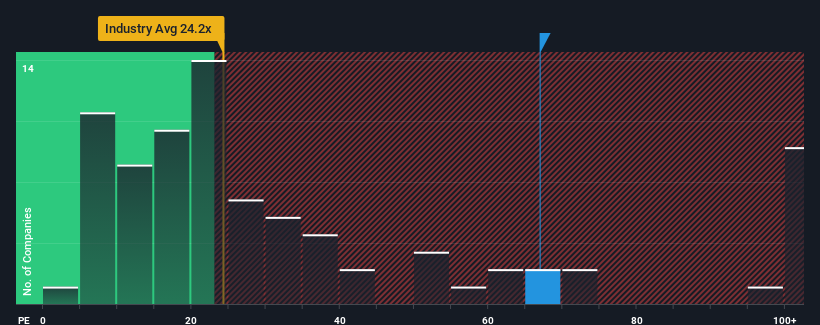
Since its price has surged higher, Visual China GroupLtd's price-to-earnings (or "P/E") ratio of 66.9x might make it look like a strong sell right now compared to the market in China, where around half of the companies have P/E ratios below 30x and even P/E's below 18x are quite common. Nonetheless, we'd need to dig a little deeper to determine if there is a rational basis for the highly elevated P/E.
With its earnings growth in positive territory compared to the declining earnings of most other companies, Visual China GroupLtd has been doing quite well of late. It seems that many are expecting the company to continue defying the broader market adversity, which has increased investors’ willingness to pay up for the stock. You'd really hope so, otherwise you're paying a pretty hefty price for no particular reason.
View our latest analysis for Visual China GroupLtd
How Is Visual China GroupLtd's Growth Trending?
The only time you'd be truly comfortable seeing a P/E as steep as Visual China GroupLtd's is when the company's growth is on track to outshine the market decidedly.
Retrospectively, the last year delivered an exceptional 73% gain to the company's bottom line. As a result, it also grew EPS by 18% in total over the last three years. So we can start by confirming that the company has actually done a good job of growing earnings over that time.
Turning to the outlook, the next year should generate growth of 25% as estimated by the dual analysts watching the company. That's shaping up to be materially lower than the 41% growth forecast for the broader market.
With this information, we find it concerning that Visual China GroupLtd is trading at a P/E higher than the market. It seems most investors are hoping for a turnaround in the company's business prospects, but the analyst cohort is not so confident this will happen. There's a good chance these shareholders are setting themselves up for future disappointment if the P/E falls to levels more in line with the growth outlook.
What We Can Learn From Visual China GroupLtd's P/E?
Shares in Visual China GroupLtd have built up some good momentum lately, which has really inflated its P/E. While the price-to-earnings ratio shouldn't be the defining factor in whether you buy a stock or not, it's quite a capable barometer of earnings expectations.
We've established that Visual China GroupLtd currently trades on a much higher than expected P/E since its forecast growth is lower than the wider market. When we see a weak earnings outlook with slower than market growth, we suspect the share price is at risk of declining, sending the high P/E lower. This places shareholders' investments at significant risk and potential investors in danger of paying an excessive premium.
A lot of potential risks can sit within a company's balance sheet. You can assess many of the main risks through our free balance sheet analysis for Visual China GroupLtd with six simple checks.
Of course, you might also be able to find a better stock than Visual China GroupLtd. So you may wish to see this free collection of other companies that have reasonable P/E ratios and have grown earnings strongly.
New: Manage All Your Stock Portfolios in One Place
We've created the ultimate portfolio companion for stock investors, and it's free.
• Connect an unlimited number of Portfolios and see your total in one currency
• Be alerted to new Warning Signs or Risks via email or mobile
• Track the Fair Value of your stocks
Have feedback on this article? Concerned about the content? Get in touch with us directly. Alternatively, email editorial-team (at) simplywallst.com.
This article by Simply Wall St is general in nature. We provide commentary based on historical data and analyst forecasts only using an unbiased methodology and our articles are not intended to be financial advice. It does not constitute a recommendation to buy or sell any stock, and does not take account of your objectives, or your financial situation. We aim to bring you long-term focused analysis driven by fundamental data. Note that our analysis may not factor in the latest price-sensitive company announcements or qualitative material. Simply Wall St has no position in any stocks mentioned.
About SZSE:000681
Visual China GroupLtd
Provides internet media and other services in China and internationally.
Flawless balance sheet with proven track record.
Similar Companies
Market Insights

Advertisement
Community Narratives
MicroVision will explode future revenue by 380.37% with a vision towards success
Fair Value US$60|98.4% undervalued
TH
Community Contributor
The Indispensable Artery for a New North American Economy
Fair Value CA$132.87|0.8% undervalued
TI
Community Contributor
Recently Updated Narratives
CO

composite32 on TAV Havalimanlari Holding ·
TAV Havalimanlari Holding will fly high with 25.68% revenue growth
Fair Value:₺545.1648.6% undervalued
1 followerusers have followed this narrative
0 commentsusers have commented on this narrative
0 likesusers have liked this narrative
RO


Robbo on Fiducian Group ·
Fiducian: Compliance Clouds or Value Opportunity?
Fair Value:AU$122.3% overvalued
1 followerusers have followed this narrative
0 commentsusers have commented on this narrative
0 likesusers have liked this narrative
MA


MarkoVT on COVER ·
Q3 Outlook modestly optimistic
Fair Value:JP¥1.65k2.0% overvalued
1 followerusers have followed this narrative
0 commentsusers have commented on this narrative
0 likesusers have liked this narrative
Popular Narratives
OS


oscargarcia on Alphabet ·
The company that turned a verb into a global necessity and basically runs the modern internet, digital ads, smartphones, maps, and AI.
Fair Value:US$3405.9% undervalued
136 followersusers have followed this narrative
6 commentsusers have commented on this narrative
18 likesusers have liked this narrative
TH

TheWallstreetKing on MicroVision ·
MicroVision will explode future revenue by 380.37% with a vision towards success
Fair Value:US$6098.4% undervalued
92 followersusers have followed this narrative
10 commentsusers have commented on this narrative
18 likesusers have liked this narrative
AN


AnalystConsensusTarget on NVIDIA ·
NVDA: Expanding AI Demand Will Drive Major Data Center Investments Through 2026
Fair Value:US$232.7922.6% undervalued
927 followersusers have followed this narrative
6 commentsusers have commented on this narrative
22 likesusers have liked this narrative