
Advertisement
Benign Growth For Shaanxi Broadcast & TV Network Intermediary(Group)Co.,Ltd. (SHSE:600831) Underpins Stock's 35% Plummet
To the annoyance of some shareholders, Shaanxi Broadcast & TV Network Intermediary(Group)Co.,Ltd. (SHSE:600831) shares are down a considerable 35% in the last month, which continues a horrid run for the company. For any long-term shareholders, the last month ends a year to forget by locking in a 69% share price decline.
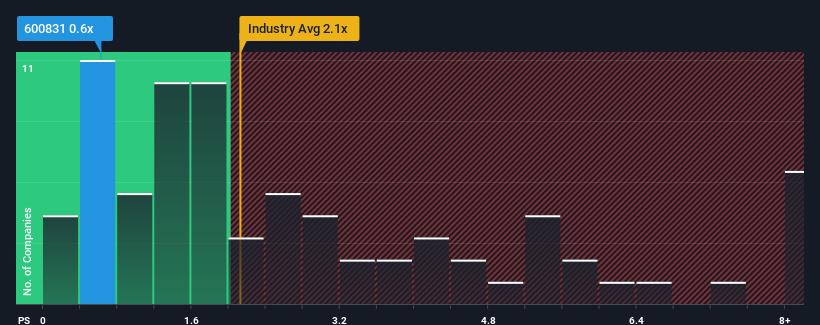
Following the heavy fall in price, Shaanxi Broadcast & TV Network Intermediary(Group)Co.Ltd may be sending buy signals at present with its price-to-sales (or "P/S") ratio of 0.6x, considering almost half of all companies in the Media industry in China have P/S ratios greater than 2.1x and even P/S higher than 5x aren't out of the ordinary. Although, it's not wise to just take the P/S at face value as there may be an explanation why it's limited.
Check out our latest analysis for Shaanxi Broadcast & TV Network Intermediary(Group)Co.Ltd
How Shaanxi Broadcast & TV Network Intermediary(Group)Co.Ltd Has Been Performing
For instance, Shaanxi Broadcast & TV Network Intermediary(Group)Co.Ltd's receding revenue in recent times would have to be some food for thought. It might be that many expect the disappointing revenue performance to continue or accelerate, which has repressed the P/S. However, if this doesn't eventuate then existing shareholders may be feeling optimistic about the future direction of the share price.
Although there are no analyst estimates available for Shaanxi Broadcast & TV Network Intermediary(Group)Co.Ltd, take a look at this free data-rich visualisation to see how the company stacks up on earnings, revenue and cash flow.Do Revenue Forecasts Match The Low P/S Ratio?
There's an inherent assumption that a company should underperform the industry for P/S ratios like Shaanxi Broadcast & TV Network Intermediary(Group)Co.Ltd's to be considered reasonable.
Retrospectively, the last year delivered a frustrating 30% decrease to the company's top line. As a result, revenue from three years ago have also fallen 24% overall. Accordingly, shareholders would have felt downbeat about the medium-term rates of revenue growth.
Weighing that medium-term revenue trajectory against the broader industry's one-year forecast for expansion of 11% shows it's an unpleasant look.
In light of this, it's understandable that Shaanxi Broadcast & TV Network Intermediary(Group)Co.Ltd's P/S would sit below the majority of other companies. However, we think shrinking revenues are unlikely to lead to a stable P/S over the longer term, which could set up shareholders for future disappointment. Even just maintaining these prices could be difficult to achieve as recent revenue trends are already weighing down the shares.
The Final Word
The southerly movements of Shaanxi Broadcast & TV Network Intermediary(Group)Co.Ltd's shares means its P/S is now sitting at a pretty low level. Generally, our preference is to limit the use of the price-to-sales ratio to establishing what the market thinks about the overall health of a company.
It's no surprise that Shaanxi Broadcast & TV Network Intermediary(Group)Co.Ltd maintains its low P/S off the back of its sliding revenue over the medium-term. At this stage investors feel the potential for an improvement in revenue isn't great enough to justify a higher P/S ratio. Given the current circumstances, it seems unlikely that the share price will experience any significant movement in either direction in the near future if recent medium-term revenue trends persist.
There are also other vital risk factors to consider and we've discovered 3 warning signs for Shaanxi Broadcast & TV Network Intermediary(Group)Co.Ltd (2 are a bit concerning!) that you should be aware of before investing here.
If these risks are making you reconsider your opinion on Shaanxi Broadcast & TV Network Intermediary(Group)Co.Ltd, explore our interactive list of high quality stocks to get an idea of what else is out there.
New: Manage All Your Stock Portfolios in One Place
We've created the ultimate portfolio companion for stock investors, and it's free.
• Connect an unlimited number of Portfolios and see your total in one currency
• Be alerted to new Warning Signs or Risks via email or mobile
• Track the Fair Value of your stocks
Have feedback on this article? Concerned about the content? Get in touch with us directly. Alternatively, email editorial-team (at) simplywallst.com.
This article by Simply Wall St is general in nature. We provide commentary based on historical data and analyst forecasts only using an unbiased methodology and our articles are not intended to be financial advice. It does not constitute a recommendation to buy or sell any stock, and does not take account of your objectives, or your financial situation. We aim to bring you long-term focused analysis driven by fundamental data. Note that our analysis may not factor in the latest price-sensitive company announcements or qualitative material. Simply Wall St has no position in any stocks mentioned.
Have feedback on this article? Concerned about the content? Get in touch with us directly. Alternatively, email editorial-team@simplywallst.com
About SHSE:600831
Shaanxi Broadcast & TV Network Intermediary(Group)Co.Ltd
Shaanxi Broadcast & TV Network Intermediary(Group)Co.,Ltd.
Slightly overvalued with imperfect balance sheet.
Market Insights

Advertisement
Community Narratives
MINISO's fair value is projected at 26.69 with an anticipated PE ratio shift of 20x
Fair Value US$24.03|11.4% undervalued
BE
Community Contributor
Procter & Gamble: A Dividend Giant Facing Slowing Growth
Fair Value US$119.81|23.5% overvalued
AN
Community Contributor
Eli Lilly's Future Growth Driven by Tirzepatide and Favorable Market Conditions
Fair Value US$1.19k|14.0% undervalued
EA
Community Contributor