
Advertisement
- China
- /
- Metals and Mining
- /
- SZSE:300828
Improved Earnings Required Before Tianjin Ruixin Technology Co.,Ltd (SZSE:300828) Stock's 40% Jump Looks Justified
Tianjin Ruixin Technology Co.,Ltd (SZSE:300828) shareholders are no doubt pleased to see that the share price has bounced 40% in the last month, although it is still struggling to make up recently lost ground. Not all shareholders will be feeling jubilant, since the share price is still down a very disappointing 24% in the last twelve months.
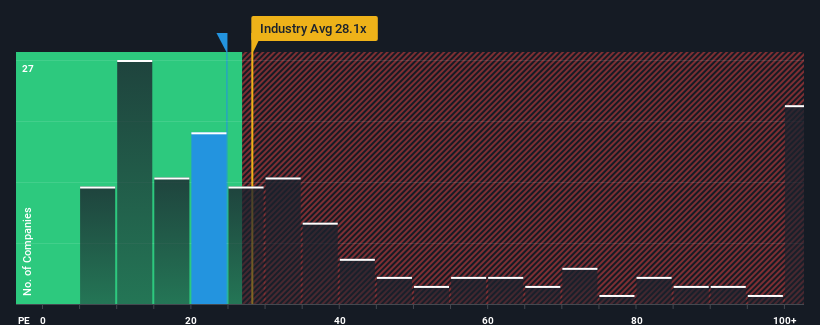
Even after such a large jump in price, Tianjin Ruixin TechnologyLtd may still be sending bullish signals at the moment with its price-to-earnings (or "P/E") ratio of 24.7x, since almost half of all companies in China have P/E ratios greater than 31x and even P/E's higher than 55x are not unusual. However, the P/E might be low for a reason and it requires further investigation to determine if it's justified.
For example, consider that Tianjin Ruixin TechnologyLtd's financial performance has been poor lately as its earnings have been in decline. It might be that many expect the disappointing earnings performance to continue or accelerate, which has repressed the P/E. However, if this doesn't eventuate then existing shareholders may be feeling optimistic about the future direction of the share price.
See our latest analysis for Tianjin Ruixin TechnologyLtd
What Are Growth Metrics Telling Us About The Low P/E?
In order to justify its P/E ratio, Tianjin Ruixin TechnologyLtd would need to produce sluggish growth that's trailing the market.
Taking a look back first, the company's earnings per share growth last year wasn't something to get excited about as it posted a disappointing decline of 20%. That put a dampener on the good run it was having over the longer-term as its three-year EPS growth is still a noteworthy 5.2% in total. So we can start by confirming that the company has generally done a good job of growing earnings over that time, even though it had some hiccups along the way.
Weighing that recent medium-term earnings trajectory against the broader market's one-year forecast for expansion of 41% shows it's noticeably less attractive on an annualised basis.
In light of this, it's understandable that Tianjin Ruixin TechnologyLtd's P/E sits below the majority of other companies. It seems most investors are expecting to see the recent limited growth rates continue into the future and are only willing to pay a reduced amount for the stock.
What We Can Learn From Tianjin Ruixin TechnologyLtd's P/E?
Tianjin Ruixin TechnologyLtd's stock might have been given a solid boost, but its P/E certainly hasn't reached any great heights. Using the price-to-earnings ratio alone to determine if you should sell your stock isn't sensible, however it can be a practical guide to the company's future prospects.
We've established that Tianjin Ruixin TechnologyLtd maintains its low P/E on the weakness of its recent three-year growth being lower than the wider market forecast, as expected. Right now shareholders are accepting the low P/E as they concede future earnings probably won't provide any pleasant surprises. Unless the recent medium-term conditions improve, they will continue to form a barrier for the share price around these levels.
Having said that, be aware Tianjin Ruixin TechnologyLtd is showing 2 warning signs in our investment analysis, and 1 of those shouldn't be ignored.
Of course, you might also be able to find a better stock than Tianjin Ruixin TechnologyLtd. So you may wish to see this free collection of other companies that have reasonable P/E ratios and have grown earnings strongly.
Valuation is complex, but we're here to simplify it.
Discover if Tianjin Ruixin TechnologyLtd might be undervalued or overvalued with our detailed analysis, featuring fair value estimates, potential risks, dividends, insider trades, and its financial condition.
Access Free AnalysisHave feedback on this article? Concerned about the content? Get in touch with us directly. Alternatively, email editorial-team (at) simplywallst.com.
This article by Simply Wall St is general in nature. We provide commentary based on historical data and analyst forecasts only using an unbiased methodology and our articles are not intended to be financial advice. It does not constitute a recommendation to buy or sell any stock, and does not take account of your objectives, or your financial situation. We aim to bring you long-term focused analysis driven by fundamental data. Note that our analysis may not factor in the latest price-sensitive company announcements or qualitative material. Simply Wall St has no position in any stocks mentioned.
About SZSE:300828
Tianjin Ruixin TechnologyLtd
Engages in the research and development, production, and sales of industrial precision aluminum alloy components in China and internationally.
Excellent balance sheet with poor track record.
Market Insights

Advertisement
Community Narratives
MINISO's fair value is projected at 26.69 with an anticipated PE ratio shift of 20x
Fair Value US$24.03|11.0% undervalued
BE
Community Contributor
Procter & Gamble: A Dividend Giant Facing Slowing Growth
Fair Value US$119.81|23.3% overvalued
AN
Community Contributor
Eli Lilly's Future Growth Driven by Tirzepatide and Favorable Market Conditions
Fair Value US$1.19k|13.8% undervalued
EA
Community Contributor