
Advertisement
- China
- /
- Basic Materials
- /
- SZSE:300737
Take Care Before Jumping Onto Keshun Waterproof Technolgies Co.,Ltd. (SZSE:300737) Even Though It's 28% Cheaper
Keshun Waterproof Technolgies Co.,Ltd. (SZSE:300737) shares have had a horrible month, losing 28% after a relatively good period beforehand. The drop over the last 30 days has capped off a tough year for shareholders, with the share price down 50% in that time.
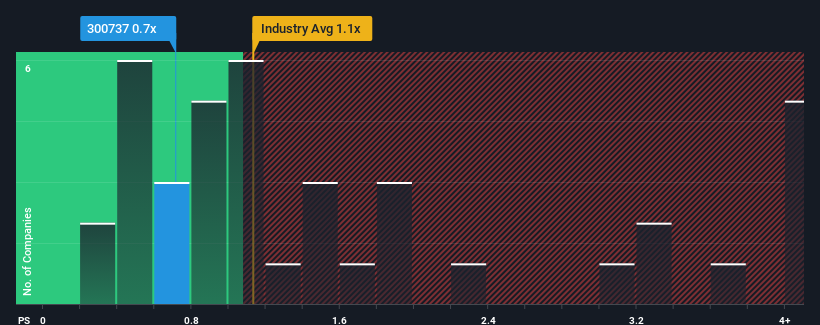
In spite of the heavy fall in price, it's still not a stretch to say that Keshun Waterproof TechnolgiesLtd's price-to-sales (or "P/S") ratio of 0.7x right now seems quite "middle-of-the-road" compared to the Basic Materials industry in China, where the median P/S ratio is around 1.1x. However, investors might be overlooking a clear opportunity or potential setback if there is no rational basis for the P/S.
See our latest analysis for Keshun Waterproof TechnolgiesLtd
What Does Keshun Waterproof TechnolgiesLtd's P/S Mean For Shareholders?
Recent times have been more advantageous for Keshun Waterproof TechnolgiesLtd as its revenue hasn't fallen as much as the rest of the industry. Perhaps the market is expecting future revenue performance fall back in line with the poorer industry performance, which has kept the P/S contained. You'd much rather the company continue improving its revenue if you still believe in the business. In saying that, existing shareholders probably aren't too pessimistic about the share price if the company's revenue continues outplaying the industry.
If you'd like to see what analysts are forecasting going forward, you should check out our free report on Keshun Waterproof TechnolgiesLtd.How Is Keshun Waterproof TechnolgiesLtd's Revenue Growth Trending?
The only time you'd be comfortable seeing a P/S like Keshun Waterproof TechnolgiesLtd's is when the company's growth is tracking the industry closely.
Retrospectively, the last year delivered a frustrating 2.9% decrease to the company's top line. That put a dampener on the good run it was having over the longer-term as its three-year revenue growth is still a noteworthy 9.8% in total. So we can start by confirming that the company has generally done a good job of growing revenue over that time, even though it had some hiccups along the way.
Looking ahead now, revenue is anticipated to climb by 16% during the coming year according to the eight analysts following the company. That's shaping up to be materially higher than the 10% growth forecast for the broader industry.
In light of this, it's curious that Keshun Waterproof TechnolgiesLtd's P/S sits in line with the majority of other companies. Apparently some shareholders are skeptical of the forecasts and have been accepting lower selling prices.
The Final Word
With its share price dropping off a cliff, the P/S for Keshun Waterproof TechnolgiesLtd looks to be in line with the rest of the Basic Materials industry. Generally, our preference is to limit the use of the price-to-sales ratio to establishing what the market thinks about the overall health of a company.
Despite enticing revenue growth figures that outpace the industry, Keshun Waterproof TechnolgiesLtd's P/S isn't quite what we'd expect. There could be some risks that the market is pricing in, which is preventing the P/S ratio from matching the positive outlook. At least the risk of a price drop looks to be subdued, but investors seem to think future revenue could see some volatility.
There are also other vital risk factors to consider before investing and we've discovered 1 warning sign for Keshun Waterproof TechnolgiesLtd that you should be aware of.
If strong companies turning a profit tickle your fancy, then you'll want to check out this free list of interesting companies that trade on a low P/E (but have proven they can grow earnings).
Valuation is complex, but we're here to simplify it.
Discover if Keshun Waterproof TechnolgiesLtd might be undervalued or overvalued with our detailed analysis, featuring fair value estimates, potential risks, dividends, insider trades, and its financial condition.
Access Free AnalysisHave feedback on this article? Concerned about the content? Get in touch with us directly. Alternatively, email editorial-team (at) simplywallst.com.
This article by Simply Wall St is general in nature. We provide commentary based on historical data and analyst forecasts only using an unbiased methodology and our articles are not intended to be financial advice. It does not constitute a recommendation to buy or sell any stock, and does not take account of your objectives, or your financial situation. We aim to bring you long-term focused analysis driven by fundamental data. Note that our analysis may not factor in the latest price-sensitive company announcements or qualitative material. Simply Wall St has no position in any stocks mentioned.
Have feedback on this article? Concerned about the content? Get in touch with us directly. Alternatively, email editorial-team@simplywallst.com
About SZSE:300737
Keshun Waterproof TechnolgiesLtd
Keshun Waterproof Technology Co.,Ltd. engages in the research and development, production, and sale of new building waterproof materials.
Fair value with moderate growth potential.
Market Insights

Advertisement
Community Narratives
MINISO's fair value is projected at 26.69 with an anticipated PE ratio shift of 20x
Fair Value US$24.03|12.0% undervalued
BE
Community Contributor
Procter & Gamble: A Dividend Giant Facing Slowing Growth
Fair Value US$119.81|21.7% overvalued
AN
Community Contributor
Eli Lilly's Future Growth Driven by Tirzepatide and Favorable Market Conditions
Fair Value US$1.19k|14.1% undervalued
EA
Community Contributor