
Advertisement
There's Reason For Concern Over Nanjing Julong Science & Technology Co.,LTD's (SZSE:300644) Massive 35% Price Jump
Nanjing Julong Science & Technology Co.,LTD (SZSE:300644) shareholders would be excited to see that the share price has had a great month, posting a 35% gain and recovering from prior weakness. The last 30 days bring the annual gain to a very sharp 43%.
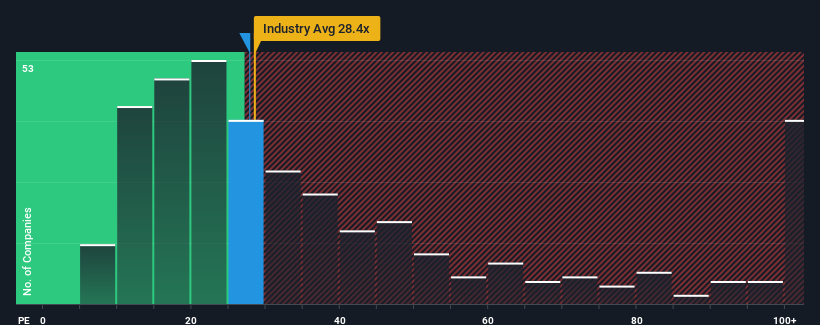
In spite of the firm bounce in price, there still wouldn't be many who think Nanjing Julong Science & TechnologyLTD's price-to-earnings (or "P/E") ratio of 27.8x is worth a mention when the median P/E in China is similar at about 30x. Although, it's not wise to simply ignore the P/E without explanation as investors may be disregarding a distinct opportunity or a costly mistake.
Recent times have been quite advantageous for Nanjing Julong Science & TechnologyLTD as its earnings have been rising very briskly. It might be that many expect the strong earnings performance to wane, which has kept the P/E from rising. If that doesn't eventuate, then existing shareholders have reason to be feeling optimistic about the future direction of the share price.
View our latest analysis for Nanjing Julong Science & TechnologyLTD
What Are Growth Metrics Telling Us About The P/E?
The only time you'd be comfortable seeing a P/E like Nanjing Julong Science & TechnologyLTD's is when the company's growth is tracking the market closely.
Taking a look back first, we see that the company grew earnings per share by an impressive 44% last year. As a result, it also grew EPS by 17% in total over the last three years. So we can start by confirming that the company has actually done a good job of growing earnings over that time.
Weighing that recent medium-term earnings trajectory against the broader market's one-year forecast for expansion of 34% shows it's noticeably less attractive on an annualised basis.
With this information, we find it interesting that Nanjing Julong Science & TechnologyLTD is trading at a fairly similar P/E to the market. It seems most investors are ignoring the fairly limited recent growth rates and are willing to pay up for exposure to the stock. They may be setting themselves up for future disappointment if the P/E falls to levels more in line with recent growth rates.
The Bottom Line On Nanjing Julong Science & TechnologyLTD's P/E
Nanjing Julong Science & TechnologyLTD appears to be back in favour with a solid price jump getting its P/E back in line with most other companies. Generally, our preference is to limit the use of the price-to-earnings ratio to establishing what the market thinks about the overall health of a company.
We've established that Nanjing Julong Science & TechnologyLTD currently trades on a higher than expected P/E since its recent three-year growth is lower than the wider market forecast. Right now we are uncomfortable with the P/E as this earnings performance isn't likely to support a more positive sentiment for long. Unless the recent medium-term conditions improve, it's challenging to accept these prices as being reasonable.
There are also other vital risk factors to consider and we've discovered 2 warning signs for Nanjing Julong Science & TechnologyLTD (1 makes us a bit uncomfortable!) that you should be aware of before investing here.
You might be able to find a better investment than Nanjing Julong Science & TechnologyLTD. If you want a selection of possible candidates, check out this free list of interesting companies that trade on a low P/E (but have proven they can grow earnings).
Valuation is complex, but we're here to simplify it.
Discover if Nanjing Julong Science & TechnologyLTD might be undervalued or overvalued with our detailed analysis, featuring fair value estimates, potential risks, dividends, insider trades, and its financial condition.
Access Free AnalysisHave feedback on this article? Concerned about the content? Get in touch with us directly. Alternatively, email editorial-team (at) simplywallst.com.
This article by Simply Wall St is general in nature. We provide commentary based on historical data and analyst forecasts only using an unbiased methodology and our articles are not intended to be financial advice. It does not constitute a recommendation to buy or sell any stock, and does not take account of your objectives, or your financial situation. We aim to bring you long-term focused analysis driven by fundamental data. Note that our analysis may not factor in the latest price-sensitive company announcements or qualitative material. Simply Wall St has no position in any stocks mentioned.
About SZSE:300644
Nanjing Julong Science & TechnologyLTD
Engages in the research and development, production, and sale of new polymer materials and their composite materials in China and internationally.
Proven track record with adequate balance sheet.
Market Insights

Advertisement
Community Narratives
Finding The True Value Of A Logistics Powerhouse
Fair Value US$95.21|8.4% undervalued
NV
Community Contributor
Paradigm Biopharmaceuticals Will Lead Osteoarthritis Treatment with Zilosul's FDA Success
Fair Value AU$5.50|92.1% undervalued
AM
Community Contributor
Barrick Mining (ABX:CA): A Gold Hedge against a U.S. Shutdown
Fair Value CA$60.00|24.2% undervalued
GM
Community Contributor