
Advertisement
Are Hubei Forbon Technology Co.,Ltd.'s (SZSE:300387) Mixed Financials Driving The Negative Sentiment?
Hubei Forbon TechnologyLtd (SZSE:300387) has had a rough month with its share price down 18%. It is possible that the markets have ignored the company's differing financials and decided to lean-in to the negative sentiment. Fundamentals usually dictate market outcomes so it makes sense to study the company's financials. Particularly, we will be paying attention to Hubei Forbon TechnologyLtd's ROE today.
Return on Equity or ROE is a test of how effectively a company is growing its value and managing investors’ money. Simply put, it is used to assess the profitability of a company in relation to its equity capital.
Check out our latest analysis for Hubei Forbon TechnologyLtd
How Is ROE Calculated?
The formula for ROE is:
Return on Equity = Net Profit (from continuing operations) ÷ Shareholders' Equity
So, based on the above formula, the ROE for Hubei Forbon TechnologyLtd is:
5.5% = CN¥76m ÷ CN¥1.4b (Based on the trailing twelve months to March 2024).
The 'return' is the profit over the last twelve months. So, this means that for every CN¥1 of its shareholder's investments, the company generates a profit of CN¥0.05.
What Has ROE Got To Do With Earnings Growth?
So far, we've learned that ROE is a measure of a company's profitability. Depending on how much of these profits the company reinvests or "retains", and how effectively it does so, we are then able to assess a company’s earnings growth potential. Generally speaking, other things being equal, firms with a high return on equity and profit retention, have a higher growth rate than firms that don’t share these attributes.
Hubei Forbon TechnologyLtd's Earnings Growth And 5.5% ROE
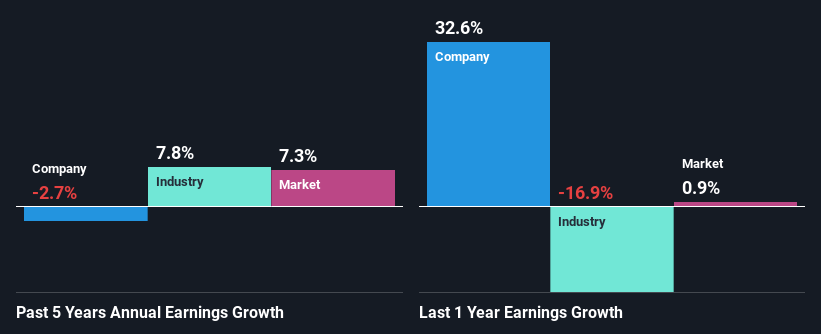
At first glance, Hubei Forbon TechnologyLtd's ROE doesn't look very promising. Yet, a closer study shows that the company's ROE is similar to the industry average of 6.3%. But then again, Hubei Forbon TechnologyLtd's five year net income shrunk at a rate of 2.7%. Remember, the company's ROE is a bit low to begin with. Therefore, the decline in earnings could also be the result of this.
That being said, we compared Hubei Forbon TechnologyLtd's performance with the industry and were concerned when we found that while the company has shrunk its earnings, the industry has grown its earnings at a rate of 7.8% in the same 5-year period.
Earnings growth is a huge factor in stock valuation. It’s important for an investor to know whether the market has priced in the company's expected earnings growth (or decline). Doing so will help them establish if the stock's future looks promising or ominous. If you're wondering about Hubei Forbon TechnologyLtd's's valuation, check out this gauge of its price-to-earnings ratio, as compared to its industry.
Is Hubei Forbon TechnologyLtd Making Efficient Use Of Its Profits?
Looking at its three-year median payout ratio of 28% (or a retention ratio of 72%) which is pretty normal, Hubei Forbon TechnologyLtd's declining earnings is rather baffling as one would expect to see a fair bit of growth when a company is retaining a good portion of its profits. It looks like there might be some other reasons to explain the lack in that respect. For example, the business could be in decline.
In addition, Hubei Forbon TechnologyLtd has been paying dividends over a period of nine years suggesting that keeping up dividend payments is preferred by the management even though earnings have been in decline.
Summary
Overall, we have mixed feelings about Hubei Forbon TechnologyLtd. While the company does have a high rate of reinvestment, the low ROE means that all that reinvestment is not reaping any benefit to its investors, and moreover, its having a negative impact on the earnings growth. Wrapping up, we would proceed with caution with this company and one way of doing that would be to look at the risk profile of the business. To know the 2 risks we have identified for Hubei Forbon TechnologyLtd visit our risks dashboard for free.
Valuation is complex, but we're here to simplify it.
Discover if Hubei Forbon TechnologyLtd might be undervalued or overvalued with our detailed analysis, featuring fair value estimates, potential risks, dividends, insider trades, and its financial condition.
Access Free AnalysisHave feedback on this article? Concerned about the content? Get in touch with us directly. Alternatively, email editorial-team (at) simplywallst.com.
This article by Simply Wall St is general in nature. We provide commentary based on historical data and analyst forecasts only using an unbiased methodology and our articles are not intended to be financial advice. It does not constitute a recommendation to buy or sell any stock, and does not take account of your objectives, or your financial situation. We aim to bring you long-term focused analysis driven by fundamental data. Note that our analysis may not factor in the latest price-sensitive company announcements or qualitative material. Simply Wall St has no position in any stocks mentioned.
About SZSE:300387
Hubei Forbon TechnologyLtd
Researches, develops, produces, and sells fertilizer additives in China and internationally.
Flawless balance sheet with high growth potential and pays a dividend.
Market Insights

Advertisement
Community Narratives
MINISO's fair value is projected at 26.69 with an anticipated PE ratio shift of 20x
Fair Value US$24.03|11.0% undervalued
BE
Community Contributor
Procter & Gamble: A Dividend Giant Facing Slowing Growth
Fair Value US$119.81|23.3% overvalued
AN
Community Contributor
Eli Lilly's Future Growth Driven by Tirzepatide and Favorable Market Conditions
Fair Value US$1.19k|13.8% undervalued
EA
Community Contributor