
Advertisement
Liaoning Oxiranchem,Inc. (SZSE:300082) Stock Rockets 27% But Many Are Still Ignoring The Company
Those holding Liaoning Oxiranchem,Inc. (SZSE:300082) shares would be relieved that the share price has rebounded 27% in the last thirty days, but it needs to keep going to repair the recent damage it has caused to investor portfolios. Not all shareholders will be feeling jubilant, since the share price is still down a very disappointing 44% in the last twelve months.
Even after such a large jump in price, Liaoning OxiranchemInc may still be sending bullish signals at the moment with its price-to-sales (or "P/S") ratio of 0.8x, since almost half of all companies in the Chemicals industry in China have P/S ratios greater than 1.9x and even P/S higher than 5x are not unusual. However, the P/S might be low for a reason and it requires further investigation to determine if it's justified.
Check out our latest analysis for Liaoning OxiranchemInc
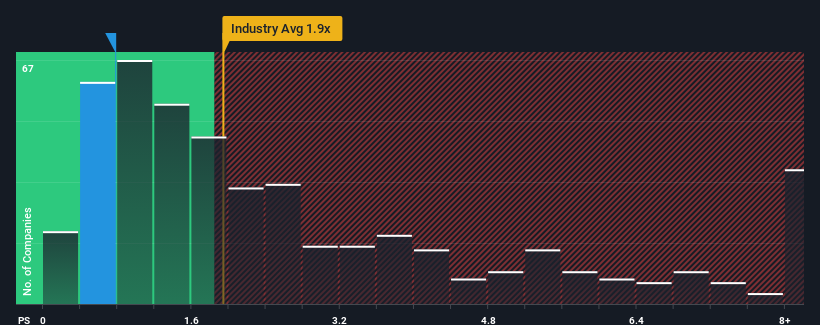
What Does Liaoning OxiranchemInc's P/S Mean For Shareholders?
Liaoning OxiranchemInc hasn't been tracking well recently as its declining revenue compares poorly to other companies, which have seen some growth in their revenues on average. Perhaps the P/S remains low as investors think the prospects of strong revenue growth aren't on the horizon. If this is the case, then existing shareholders will probably struggle to get excited about the future direction of the share price.
If you'd like to see what analysts are forecasting going forward, you should check out our free report on Liaoning OxiranchemInc.Is There Any Revenue Growth Forecasted For Liaoning OxiranchemInc?
There's an inherent assumption that a company should underperform the industry for P/S ratios like Liaoning OxiranchemInc's to be considered reasonable.
Retrospectively, the last year delivered a frustrating 30% decrease to the company's top line. As a result, revenue from three years ago have also fallen 26% overall. Therefore, it's fair to say the revenue growth recently has been undesirable for the company.
Turning to the outlook, the next year should generate growth of 63% as estimated by the sole analyst watching the company. Meanwhile, the rest of the industry is forecast to only expand by 25%, which is noticeably less attractive.
With this in consideration, we find it intriguing that Liaoning OxiranchemInc's P/S sits behind most of its industry peers. It looks like most investors are not convinced at all that the company can achieve future growth expectations.
The Key Takeaway
Despite Liaoning OxiranchemInc's share price climbing recently, its P/S still lags most other companies. Generally, our preference is to limit the use of the price-to-sales ratio to establishing what the market thinks about the overall health of a company.
A look at Liaoning OxiranchemInc's revenues reveals that, despite glowing future growth forecasts, its P/S is much lower than we'd expect. The reason for this depressed P/S could potentially be found in the risks the market is pricing in. It appears the market could be anticipating revenue instability, because these conditions should normally provide a boost to the share price.
Many other vital risk factors can be found on the company's balance sheet. You can assess many of the main risks through our free balance sheet analysis for Liaoning OxiranchemInc with six simple checks.
It's important to make sure you look for a great company, not just the first idea you come across. So if growing profitability aligns with your idea of a great company, take a peek at this free list of interesting companies with strong recent earnings growth (and a low P/E).
New: AI Stock Screener & Alerts
Our new AI Stock Screener scans the market every day to uncover opportunities.
• Dividend Powerhouses (3%+ Yield)
• Undervalued Small Caps with Insider Buying
• High growth Tech and AI Companies
Or build your own from over 50 metrics.
Have feedback on this article? Concerned about the content? Get in touch with us directly. Alternatively, email editorial-team (at) simplywallst.com.
This article by Simply Wall St is general in nature. We provide commentary based on historical data and analyst forecasts only using an unbiased methodology and our articles are not intended to be financial advice. It does not constitute a recommendation to buy or sell any stock, and does not take account of your objectives, or your financial situation. We aim to bring you long-term focused analysis driven by fundamental data. Note that our analysis may not factor in the latest price-sensitive company announcements or qualitative material. Simply Wall St has no position in any stocks mentioned.
About SZSE:300082
Liaoning OxiranchemInc
Engages in the research and development, production, and sale of high-end and ethylene oxide derivative fine chemicals in China and internationally.
Moderate growth potential and slightly overvalued.
Market Insights

Advertisement
Community Narratives
MicroVision will explode future revenue by 380.37% with a vision towards success
Fair Value US$60.00|98.4% undervalued
TH
Community Contributor
The Indispensable Artery for a New North American Economy
Fair Value CA$132.87|3.6% undervalued
TI
Community Contributor