Advertisement
Global Market Insights: 3 Penny Stocks With Market Caps Under US$2B

Simply Wall St
Reviewed by Simply Wall St
Global markets have recently faced challenges, with U.S. stock indexes experiencing declines due to renewed tariffs, trade policy uncertainty, and weak economic data. Despite these headwinds, there are still opportunities for investors willing to explore different segments of the market. Penny stocks—often associated with smaller or newer companies—remain a viable area for potential growth when backed by strong financial health and fundamentals.
Top 10 Penny Stocks Globally
| Name | Share Price | Market Cap | Rewards & Risks |
| EZZ Life Science Holdings (ASX:EZZ) | A$2.35 | A$111.33M | ✅ 4 ⚠️ 3 View Analysis > |
| Lever Style (SEHK:1346) | HK$1.44 | HK$895.95M | ✅ 4 ⚠️ 1 View Analysis > |
| GTN (ASX:GTN) | A$0.38 | A$71.5M | ✅ 4 ⚠️ 2 View Analysis > |
| Angler Gaming (NGM:ANGL) | SEK3.60 | SEK269.95M | ✅ 4 ⚠️ 2 View Analysis > |
| CNMC Goldmine Holdings (Catalist:5TP) | SGD0.535 | SGD216.83M | ✅ 4 ⚠️ 1 View Analysis > |
| MGB Berhad (KLSE:MGB) | MYR0.505 | MYR298.78M | ✅ 5 ⚠️ 2 View Analysis > |
| Yangzijiang Shipbuilding (Holdings) (SGX:BS6) | SGD2.63 | SGD10.35B | ✅ 5 ⚠️ 0 View Analysis > |
| Zetrix AI Berhad (KLSE:ZETRIX) | MYR0.87 | MYR6.7B | ✅ 5 ⚠️ 2 View Analysis > |
| Begbies Traynor Group (AIM:BEG) | £1.215 | £193.11M | ✅ 4 ⚠️ 2 View Analysis > |
| Netgem (ENXTPA:ALNTG) | €0.966 | €32.58M | ✅ 4 ⚠️ 2 View Analysis > |
Click here to see the full list of 3,804 stocks from our Global Penny Stocks screener.
Below we spotlight a couple of our favorites from our exclusive screener.
CASIN Real Estate Development GroupLtd (SZSE:000838)
Simply Wall St Financial Health Rating: ★★★★☆☆
Overview: CASIN Real Estate Development Group Co., Ltd. operates in the real estate development sector with a market capitalization of CN¥3.29 billion.
Operations: The company generates its revenue primarily from the Chinese market, amounting to CN¥559.65 million.
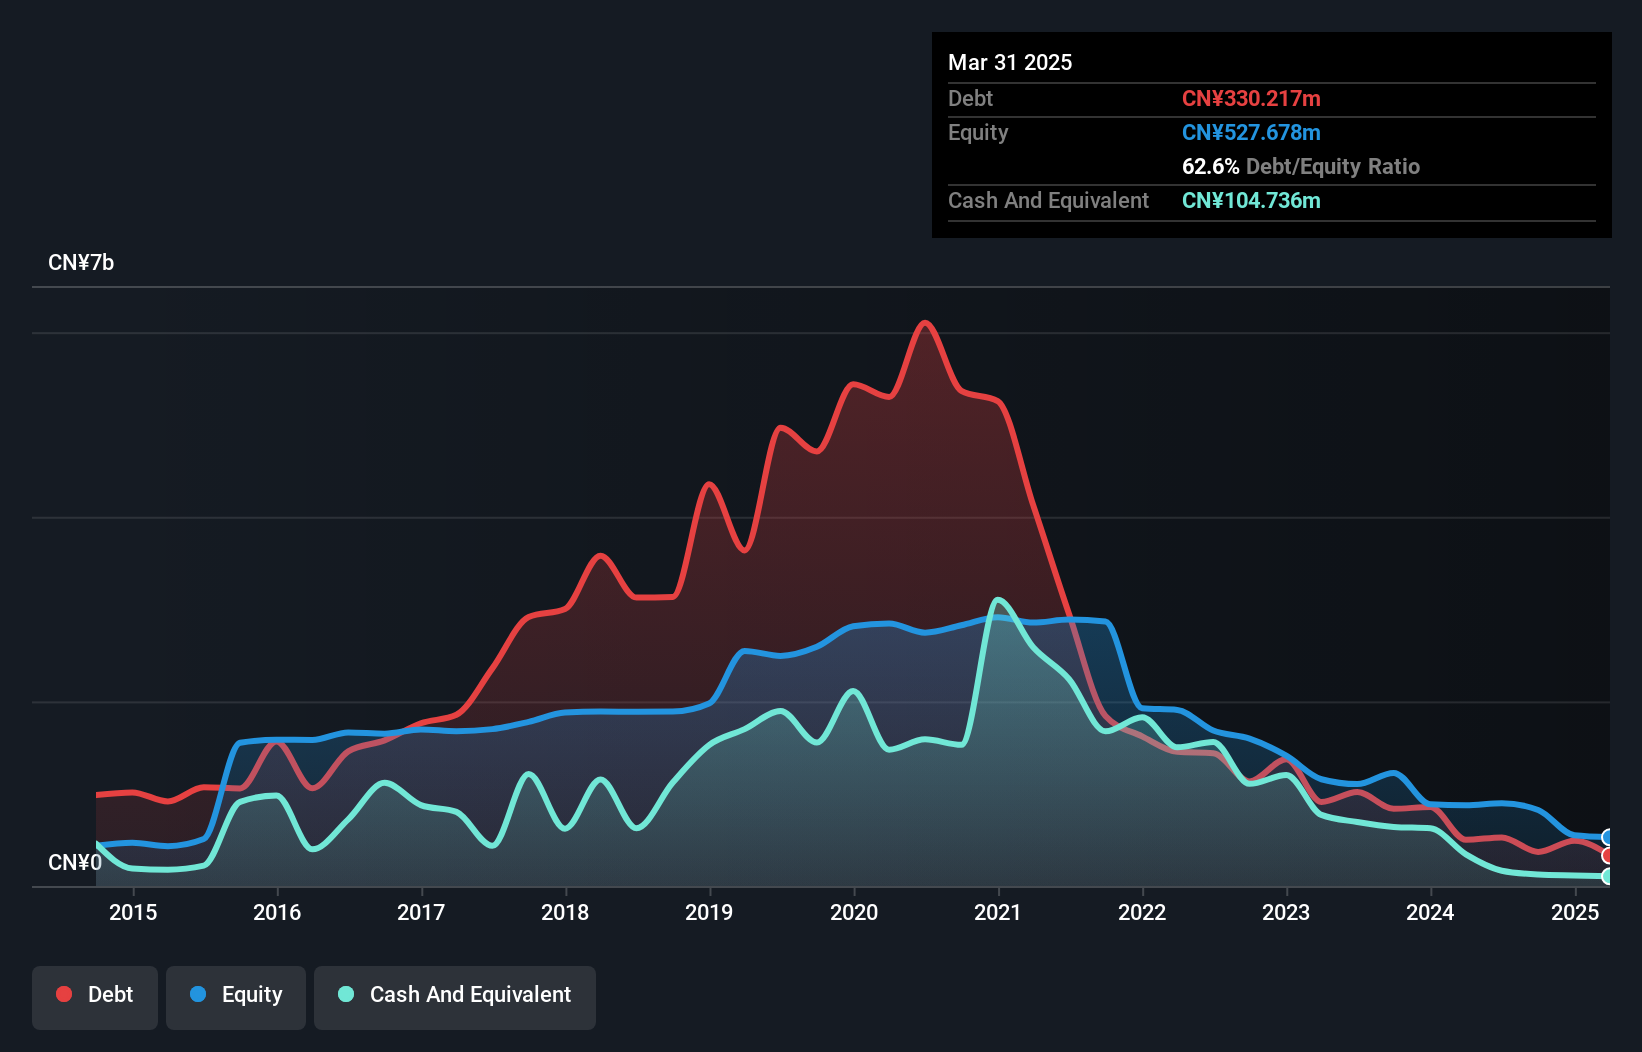
Market Cap: CN¥3.29B
CASIN Real Estate Development Group Ltd., with a market cap of CN¥3.29 billion, faces challenges as an unprofitable entity, having seen increased losses over the past five years. Despite this, it boasts a seasoned management team and board of directors with average tenures of 4.4 and 3.3 years respectively. The company has improved its debt situation significantly over the last five years, reducing its debt to equity ratio from 186.3% to 62.6%. However, it remains highly volatile in terms of share price and has less than one year of cash runway if current free cash flow trends continue.
- Click here and access our complete financial health analysis report to understand the dynamics of CASIN Real Estate Development GroupLtd.
- Evaluate CASIN Real Estate Development GroupLtd's historical performance by accessing our past performance report.
Beijing Haixin Energy TechnologyLtd (SZSE:300072)
Simply Wall St Financial Health Rating: ★★★★★☆
Overview: Beijing Haixin Energy Technology Co., Ltd. (SZSE:300072) operates within the energy technology sector and has a market capitalization of CN¥8.15 billion.
Operations: Beijing Haixin Energy Technology Co., Ltd. has not reported any specific revenue segments.
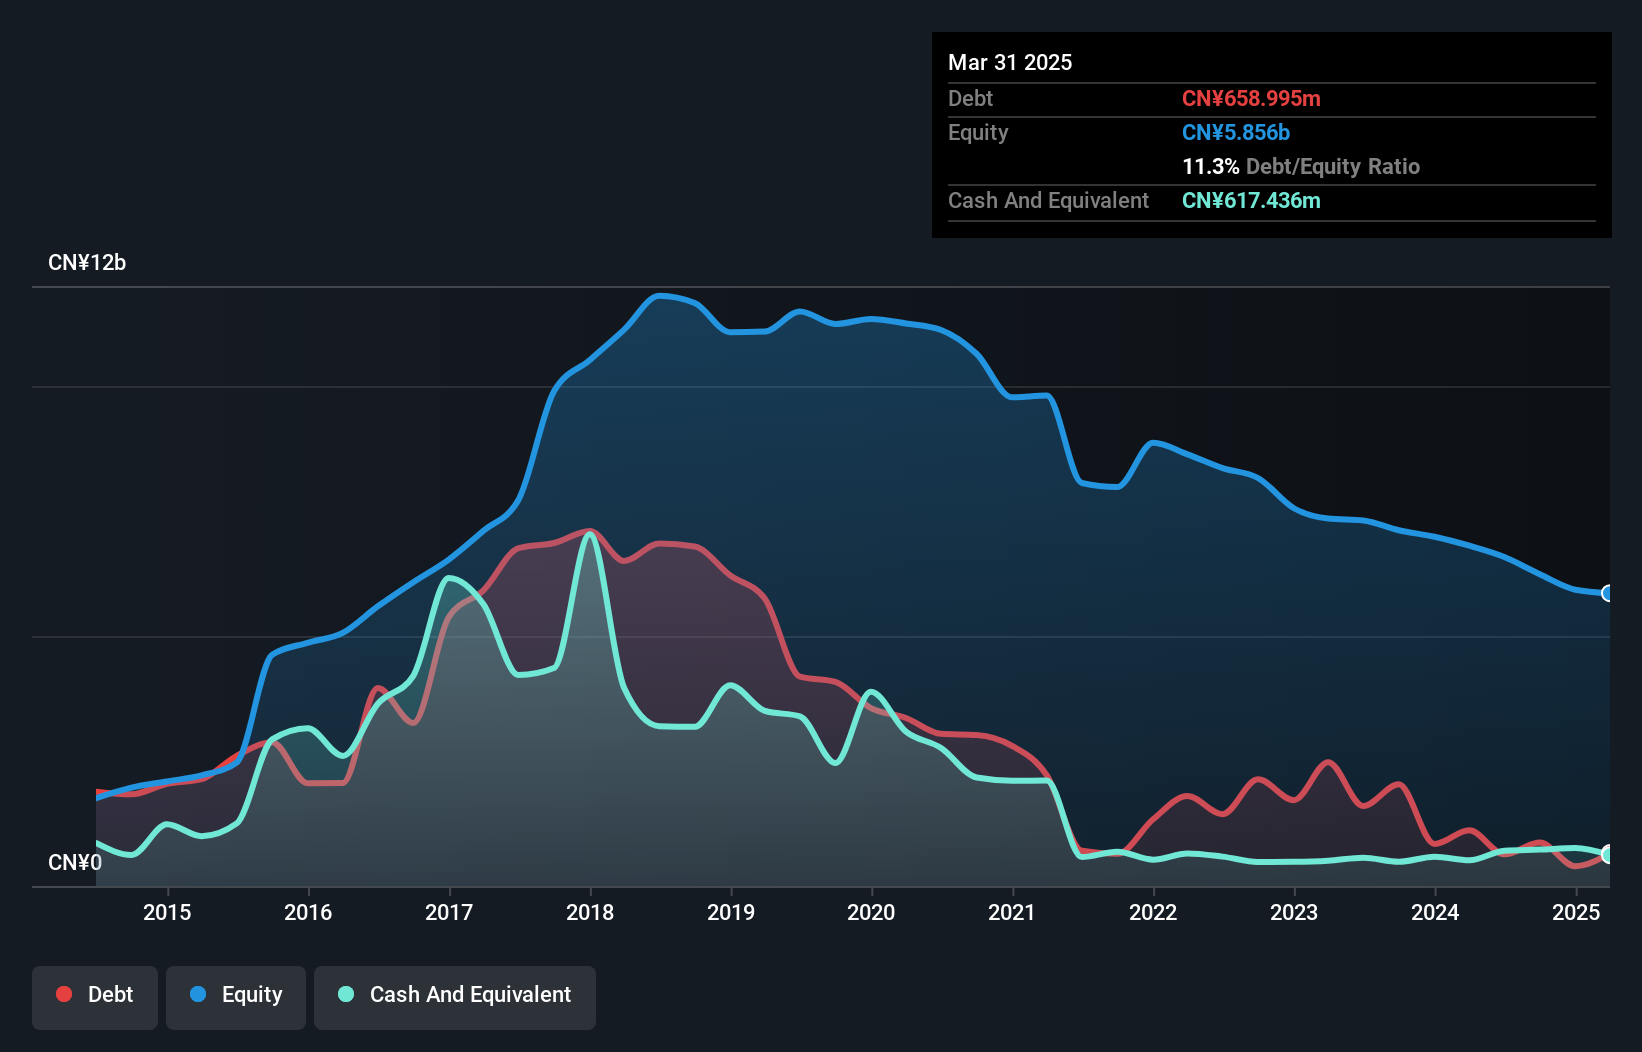
Market Cap: CN¥8.15B
Beijing Haixin Energy Technology Co., Ltd., with a market cap of CN¥8.15 billion, is currently unprofitable but has reduced its losses by 2.4% annually over the past five years. The company’s short-term assets of CN¥4.2 billion comfortably exceed both its long-term and short-term liabilities, indicating solid liquidity management. Despite having a satisfactory net debt to equity ratio of 0.7%, the company's share price remains highly volatile, and its board lacks experience with an average tenure of 1.8 years. Revenue is projected to grow significantly at 35.68% per year, highlighting potential future growth prospects despite current challenges.
- Dive into the specifics of Beijing Haixin Energy TechnologyLtd here with our thorough balance sheet health report.
- Learn about Beijing Haixin Energy TechnologyLtd's future growth trajectory here.
Hainan Shennong Seed Industry Technology (SZSE:300189)
Simply Wall St Financial Health Rating: ★★★★★☆
Overview: Hainan Shennong Seed Industry Technology Co., Ltd. operates in the agricultural sector, focusing on seed production and technology, with a market cap of CN¥4.93 billion.
Operations: Hainan Shennong Seed Industry Technology Co., Ltd. currently does not report any specific revenue segments.
Market Cap: CN¥4.93B
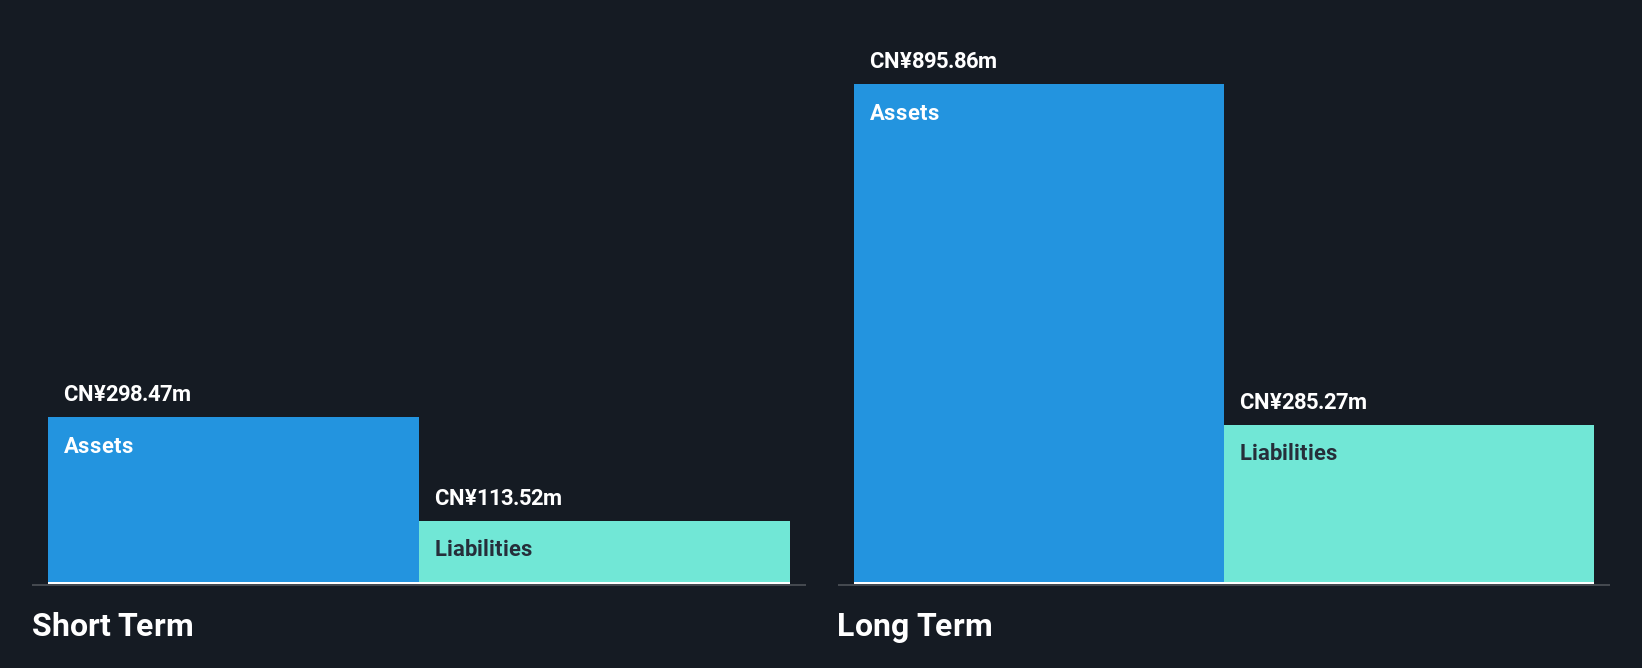
Hainan Shennong Seed Industry Technology Co., Ltd., with a market cap of CN¥4.93 billion, is currently pre-revenue and unprofitable, though it has reduced its losses by 41.7% annually over the past five years. The company maintains a satisfactory net debt to equity ratio of 13.7%, and its short-term assets of CN¥270.4 million exceed both short-term and long-term liabilities, suggesting sound financial management despite recent increases in debt levels. A planned private placement aims to raise CN¥144 million through issuing shares to specific investors, pending regulatory approval, which may impact shareholder returns post-offering as considered in an upcoming shareholders meeting.
- Navigate through the intricacies of Hainan Shennong Seed Industry Technology with our comprehensive balance sheet health report here.
- Review our historical performance report to gain insights into Hainan Shennong Seed Industry Technology's track record.
Key Takeaways
- Take a closer look at our Global Penny Stocks list of 3,804 companies by clicking here.
- Ready To Venture Into Other Investment Styles? Diversify your portfolio with solid dividend payers offering reliable income streams to weather potential market turbulence.
This article by Simply Wall St is general in nature. We provide commentary based on historical data and analyst forecasts only using an unbiased methodology and our articles are not intended to be financial advice. It does not constitute a recommendation to buy or sell any stock, and does not take account of your objectives, or your financial situation. We aim to bring you long-term focused analysis driven by fundamental data. Note that our analysis may not factor in the latest price-sensitive company announcements or qualitative material. Simply Wall St has no position in any stocks mentioned.
Valuation is complex, but we're here to simplify it.
Discover if Hainan Shennong Seed Industry Technology might be undervalued or overvalued with our detailed analysis, featuring fair value estimates, potential risks, dividends, insider trades, and its financial condition.
Access Free AnalysisHave feedback on this article? Concerned about the content? Get in touch with us directly. Alternatively, email editorial-team@simplywallst.com
About SZSE:300189
Hainan Shennong Seed Industry Technology
Hainan Shennong Seed Industry Technology Co., Ltd.
Excellent balance sheet with weak fundamentals.
Market Insights

Advertisement
Community Narratives
MINISO's fair value is projected at 26.69 with an anticipated PE ratio shift of 20x
Fair Value US$24.03|9.0% undervalued
BE
Community Contributor
Procter & Gamble: A Dividend Giant Facing Slowing Growth
Fair Value US$119.81|23.5% overvalued
AN
Community Contributor
Eli Lilly's Future Growth Driven by Tirzepatide and Favorable Market Conditions
Fair Value US$1.19k|14.4% undervalued
EA
Community Contributor