
Advertisement
Guangdong Tengen Industrial GroupLtd (SZSE:003003) Will Want To Turn Around Its Return Trends
Finding a business that has the potential to grow substantially is not easy, but it is possible if we look at a few key financial metrics. Amongst other things, we'll want to see two things; firstly, a growing return on capital employed (ROCE) and secondly, an expansion in the company's amount of capital employed. Basically this means that a company has profitable initiatives that it can continue to reinvest in, which is a trait of a compounding machine. However, after investigating Guangdong Tengen Industrial GroupLtd (SZSE:003003), we don't think it's current trends fit the mold of a multi-bagger.
Understanding Return On Capital Employed (ROCE)
For those who don't know, ROCE is a measure of a company's yearly pre-tax profit (its return), relative to the capital employed in the business. To calculate this metric for Guangdong Tengen Industrial GroupLtd, this is the formula:
Return on Capital Employed = Earnings Before Interest and Tax (EBIT) ÷ (Total Assets - Current Liabilities)
0.019 = CN¥25m ÷ (CN¥1.6b - CN¥247m) (Based on the trailing twelve months to September 2023).
Therefore, Guangdong Tengen Industrial GroupLtd has an ROCE of 1.9%. In absolute terms, that's a low return and it also under-performs the Packaging industry average of 4.4%.
See our latest analysis for Guangdong Tengen Industrial GroupLtd
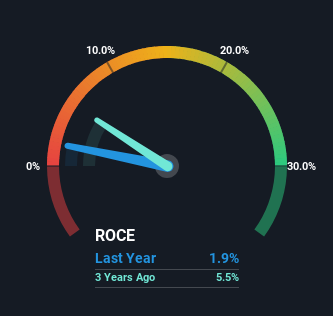
Historical performance is a great place to start when researching a stock so above you can see the gauge for Guangdong Tengen Industrial GroupLtd's ROCE against it's prior returns. If you want to delve into the historical earnings , check out these free graphs detailing revenue and cash flow performance of Guangdong Tengen Industrial GroupLtd.
What Does the ROCE Trend For Guangdong Tengen Industrial GroupLtd Tell Us?
On the surface, the trend of ROCE at Guangdong Tengen Industrial GroupLtd doesn't inspire confidence. Over the last five years, returns on capital have decreased to 1.9% from 12% five years ago. Meanwhile, the business is utilizing more capital but this hasn't moved the needle much in terms of sales in the past 12 months, so this could reflect longer term investments. It's worth keeping an eye on the company's earnings from here on to see if these investments do end up contributing to the bottom line.
The Bottom Line
In summary, Guangdong Tengen Industrial GroupLtd is reinvesting funds back into the business for growth but unfortunately it looks like sales haven't increased much just yet. And investors appear hesitant that the trends will pick up because the stock has fallen 48% in the last three years. Therefore based on the analysis done in this article, we don't think Guangdong Tengen Industrial GroupLtd has the makings of a multi-bagger.
One final note, you should learn about the 3 warning signs we've spotted with Guangdong Tengen Industrial GroupLtd (including 1 which shouldn't be ignored) .
If you want to search for solid companies with great earnings, check out this free list of companies with good balance sheets and impressive returns on equity.
New: Manage All Your Stock Portfolios in One Place
We've created the ultimate portfolio companion for stock investors, and it's free.
• Connect an unlimited number of Portfolios and see your total in one currency
• Be alerted to new Warning Signs or Risks via email or mobile
• Track the Fair Value of your stocks
Have feedback on this article? Concerned about the content? Get in touch with us directly. Alternatively, email editorial-team (at) simplywallst.com.
This article by Simply Wall St is general in nature. We provide commentary based on historical data and analyst forecasts only using an unbiased methodology and our articles are not intended to be financial advice. It does not constitute a recommendation to buy or sell any stock, and does not take account of your objectives, or your financial situation. We aim to bring you long-term focused analysis driven by fundamental data. Note that our analysis may not factor in the latest price-sensitive company announcements or qualitative material. Simply Wall St has no position in any stocks mentioned.
About SZSE:003003
Guangdong Tengen Industrial GroupLtd
Guangdong Tengen Industrial Group Co.,Ltd.
Excellent balance sheet and good value.
Market Insights

Advertisement
Community Narratives
MINISO's fair value is projected at 26.69 with an anticipated PE ratio shift of 20x
Fair Value US$24.03|12.0% undervalued
BE
Community Contributor
Procter & Gamble: A Dividend Giant Facing Slowing Growth
Fair Value US$119.81|21.7% overvalued
AN
Community Contributor
Eli Lilly's Future Growth Driven by Tirzepatide and Favorable Market Conditions
Fair Value US$1.19k|14.1% undervalued
EA
Community Contributor