
Advertisement
- China
- /
- Metals and Mining
- /
- SZSE:002978
Earnings Troubles May Signal Larger Issues for Sichuan Anning Iron and TitaniumLtd (SZSE:002978) Shareholders
A lackluster earnings announcement from Sichuan Anning Iron and Titanium Co.,Ltd. (SZSE:002978) last week didn't sink the stock price. Our analysis suggests that along with soft profit numbers, investors should be aware of some other underlying weaknesses in the numbers.
Check out our latest analysis for Sichuan Anning Iron and TitaniumLtd
Examining Cashflow Against Sichuan Anning Iron and TitaniumLtd's Earnings
One key financial ratio used to measure how well a company converts its profit to free cash flow (FCF) is the accrual ratio. To get the accrual ratio we first subtract FCF from profit for a period, and then divide that number by the average operating assets for the period. You could think of the accrual ratio from cashflow as the 'non-FCF profit ratio'.
That means a negative accrual ratio is a good thing, because it shows that the company is bringing in more free cash flow than its profit would suggest. That is not intended to imply we should worry about a positive accrual ratio, but it's worth noting where the accrual ratio is rather high. To quote a 2014 paper by Lewellen and Resutek, "firms with higher accruals tend to be less profitable in the future".
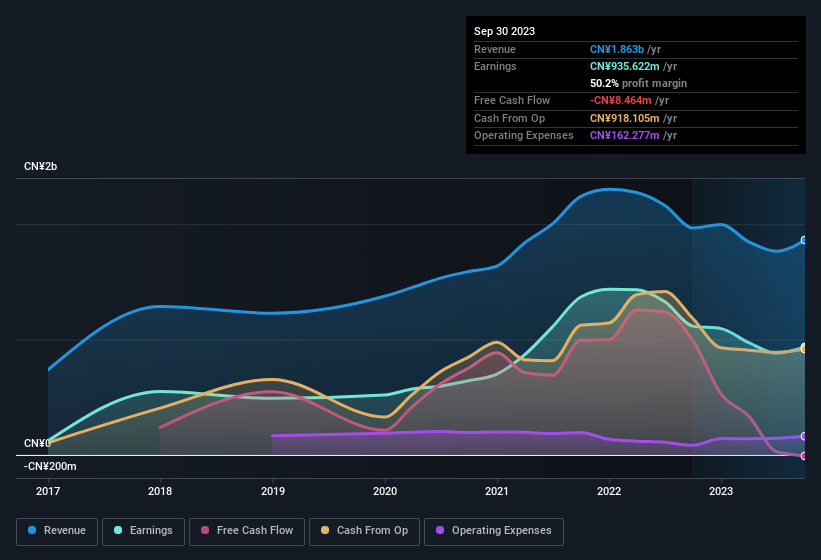
Sichuan Anning Iron and TitaniumLtd has an accrual ratio of 0.29 for the year to September 2023. Unfortunately, that means its free cash flow was a lot less than its statutory profit, which makes us doubt the utility of profit as a guide. Even though it reported a profit of CN¥935.6m, a look at free cash flow indicates it actually burnt through CN¥8.5m in the last year. We saw that FCF was CN¥992m a year ago though, so Sichuan Anning Iron and TitaniumLtd has at least been able to generate positive FCF in the past.
That might leave you wondering what analysts are forecasting in terms of future profitability. Luckily, you can click here to see an interactive graph depicting future profitability, based on their estimates.
Our Take On Sichuan Anning Iron and TitaniumLtd's Profit Performance
Sichuan Anning Iron and TitaniumLtd didn't convert much of its profit to free cash flow in the last year, which some investors may consider rather suboptimal. Because of this, we think that it may be that Sichuan Anning Iron and TitaniumLtd's statutory profits are better than its underlying earnings power. But at least holders can take some solace from the 37% per annum growth in EPS for the last three. Of course, we've only just scratched the surface when it comes to analysing its earnings; one could also consider margins, forecast growth, and return on investment, among other factors. In light of this, if you'd like to do more analysis on the company, it's vital to be informed of the risks involved. For example, Sichuan Anning Iron and TitaniumLtd has 2 warning signs (and 1 which shouldn't be ignored) we think you should know about.
Today we've zoomed in on a single data point to better understand the nature of Sichuan Anning Iron and TitaniumLtd's profit. But there is always more to discover if you are capable of focussing your mind on minutiae. For example, many people consider a high return on equity as an indication of favorable business economics, while others like to 'follow the money' and search out stocks that insiders are buying. While it might take a little research on your behalf, you may find this free collection of companies boasting high return on equity, or this list of stocks that insiders are buying to be useful.
New: Manage All Your Stock Portfolios in One Place
We've created the ultimate portfolio companion for stock investors, and it's free.
• Connect an unlimited number of Portfolios and see your total in one currency
• Be alerted to new Warning Signs or Risks via email or mobile
• Track the Fair Value of your stocks
Have feedback on this article? Concerned about the content? Get in touch with us directly. Alternatively, email editorial-team (at) simplywallst.com.
This article by Simply Wall St is general in nature. We provide commentary based on historical data and analyst forecasts only using an unbiased methodology and our articles are not intended to be financial advice. It does not constitute a recommendation to buy or sell any stock, and does not take account of your objectives, or your financial situation. We aim to bring you long-term focused analysis driven by fundamental data. Note that our analysis may not factor in the latest price-sensitive company announcements or qualitative material. Simply Wall St has no position in any stocks mentioned.
About SZSE:002978
Sichuan Anning Iron and TitaniumLtd
Sichuan Anning Iron and Titanium Co.,Ltd.
Fair value with mediocre balance sheet.
Market Insights

Advertisement
Community Narratives
MicroVision will explode future revenue by 380.37% with a vision towards success
Fair Value US$60.00|98.5% undervalued
TH
Community Contributor
The Indispensable Artery for a New North American Economy
Fair Value CA$132.87|2.3% undervalued
TI
Community Contributor