
Advertisement
Capital Allocation Trends At Shenzhen King Explorer Science and Technology (SZSE:002917) Aren't Ideal
If you're not sure where to start when looking for the next multi-bagger, there are a few key trends you should keep an eye out for. Ideally, a business will show two trends; firstly a growing return on capital employed (ROCE) and secondly, an increasing amount of capital employed. This shows us that it's a compounding machine, able to continually reinvest its earnings back into the business and generate higher returns. However, after briefly looking over the numbers, we don't think Shenzhen King Explorer Science and Technology (SZSE:002917) has the makings of a multi-bagger going forward, but let's have a look at why that may be.
What Is Return On Capital Employed (ROCE)?
If you haven't worked with ROCE before, it measures the 'return' (pre-tax profit) a company generates from capital employed in its business. To calculate this metric for Shenzhen King Explorer Science and Technology, this is the formula:
Return on Capital Employed = Earnings Before Interest and Tax (EBIT) ÷ (Total Assets - Current Liabilities)
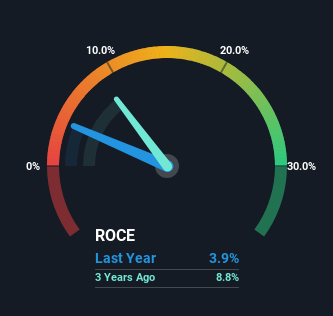
0.039 = CN¥76m ÷ (CN¥3.1b - CN¥1.2b) (Based on the trailing twelve months to September 2023).
Therefore, Shenzhen King Explorer Science and Technology has an ROCE of 3.9%. Ultimately, that's a low return and it under-performs the Chemicals industry average of 5.9%.
See our latest analysis for Shenzhen King Explorer Science and Technology
In the above chart we have measured Shenzhen King Explorer Science and Technology's prior ROCE against its prior performance, but the future is arguably more important. If you're interested, you can view the analysts predictions in our free analyst report for Shenzhen King Explorer Science and Technology .
What The Trend Of ROCE Can Tell Us
On the surface, the trend of ROCE at Shenzhen King Explorer Science and Technology doesn't inspire confidence. Around five years ago the returns on capital were 10%, but since then they've fallen to 3.9%. However, given capital employed and revenue have both increased it appears that the business is currently pursuing growth, at the consequence of short term returns. And if the increased capital generates additional returns, the business, and thus shareholders, will benefit in the long run.
While on the subject, we noticed that the ratio of current liabilities to total assets has risen to 37%, which has impacted the ROCE. If current liabilities hadn't increased as much as they did, the ROCE could actually be even lower. Keep an eye on this ratio, because the business could encounter some new risks if this metric gets too high.
The Bottom Line On Shenzhen King Explorer Science and Technology's ROCE
Even though returns on capital have fallen in the short term, we find it promising that revenue and capital employed have both increased for Shenzhen King Explorer Science and Technology. And there could be an opportunity here if other metrics look good too, because the stock has declined 18% in the last five years. As a result, we'd recommend researching this stock further to uncover what other fundamentals of the business can show us.
On a separate note, we've found 2 warning signs for Shenzhen King Explorer Science and Technology you'll probably want to know about.
If you want to search for solid companies with great earnings, check out this free list of companies with good balance sheets and impressive returns on equity.
New: Manage All Your Stock Portfolios in One Place
We've created the ultimate portfolio companion for stock investors, and it's free.
• Connect an unlimited number of Portfolios and see your total in one currency
• Be alerted to new Warning Signs or Risks via email or mobile
• Track the Fair Value of your stocks
Have feedback on this article? Concerned about the content? Get in touch with us directly. Alternatively, email editorial-team (at) simplywallst.com.
This article by Simply Wall St is general in nature. We provide commentary based on historical data and analyst forecasts only using an unbiased methodology and our articles are not intended to be financial advice. It does not constitute a recommendation to buy or sell any stock, and does not take account of your objectives, or your financial situation. We aim to bring you long-term focused analysis driven by fundamental data. Note that our analysis may not factor in the latest price-sensitive company announcements or qualitative material. Simply Wall St has no position in any stocks mentioned.
About SZSE:002917
Shenzhen King Explorer Science and Technology
Researches, designs, develops, manufactures, and sells intelligent equipment systems to civil explosive production and blasting service companies in China and internationally.
High growth potential with excellent balance sheet.
Market Insights

Advertisement
Community Narratives
Finding The True Value Of A Logistics Powerhouse
Fair Value US$95.21|8.4% undervalued
NV
Community Contributor
Paradigm Biopharmaceuticals Will Lead Osteoarthritis Treatment with Zilosul's FDA Success
Fair Value AU$5.50|92.1% undervalued
AM
Community Contributor
Barrick Mining (ABX:CA): A Gold Hedge against a U.S. Shutdown
Fair Value CA$60.00|24.2% undervalued
GM
Community Contributor