
Advertisement
Benign Growth For Chongqing Sansheng Industrial Co.,Ltd. (SZSE:002742) Underpins Stock's 27% Plummet
Chongqing Sansheng Industrial Co.,Ltd. (SZSE:002742) shares have had a horrible month, losing 27% after a relatively good period beforehand. The drop over the last 30 days has capped off a tough year for shareholders, with the share price down 40% in that time.
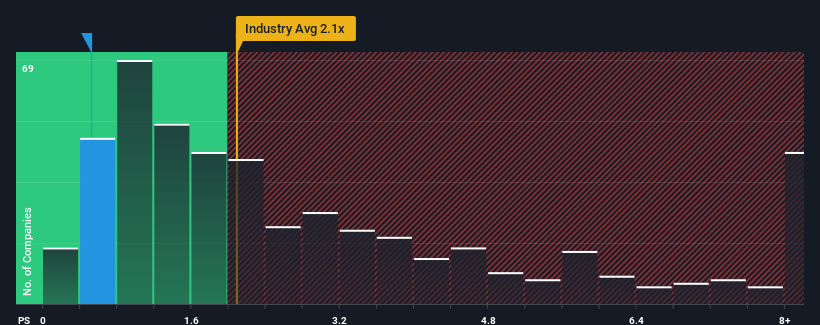
Following the heavy fall in price, Chongqing Sansheng IndustrialLtd's price-to-sales (or "P/S") ratio of 0.5x might make it look like a buy right now compared to the Chemicals industry in China, where around half of the companies have P/S ratios above 2.1x and even P/S above 5x are quite common. However, the P/S might be low for a reason and it requires further investigation to determine if it's justified.
Check out our latest analysis for Chongqing Sansheng IndustrialLtd
What Does Chongqing Sansheng IndustrialLtd's Recent Performance Look Like?
For example, consider that Chongqing Sansheng IndustrialLtd's financial performance has been poor lately as its revenue has been in decline. One possibility is that the P/S is low because investors think the company won't do enough to avoid underperforming the broader industry in the near future. Those who are bullish on Chongqing Sansheng IndustrialLtd will be hoping that this isn't the case so that they can pick up the stock at a lower valuation.
Want the full picture on earnings, revenue and cash flow for the company? Then our free report on Chongqing Sansheng IndustrialLtd will help you shine a light on its historical performance.Is There Any Revenue Growth Forecasted For Chongqing Sansheng IndustrialLtd?
Chongqing Sansheng IndustrialLtd's P/S ratio would be typical for a company that's only expected to deliver limited growth, and importantly, perform worse than the industry.
Retrospectively, the last year delivered a frustrating 11% decrease to the company's top line. This means it has also seen a slide in revenue over the longer-term as revenue is down 29% in total over the last three years. Accordingly, shareholders would have felt downbeat about the medium-term rates of revenue growth.
Comparing that to the industry, which is predicted to deliver 24% growth in the next 12 months, the company's downward momentum based on recent medium-term revenue results is a sobering picture.
With this in mind, we understand why Chongqing Sansheng IndustrialLtd's P/S is lower than most of its industry peers. However, we think shrinking revenues are unlikely to lead to a stable P/S over the longer term, which could set up shareholders for future disappointment. Even just maintaining these prices could be difficult to achieve as recent revenue trends are already weighing down the shares.
The Final Word
Chongqing Sansheng IndustrialLtd's P/S has taken a dip along with its share price. Generally, our preference is to limit the use of the price-to-sales ratio to establishing what the market thinks about the overall health of a company.
It's no surprise that Chongqing Sansheng IndustrialLtd maintains its low P/S off the back of its sliding revenue over the medium-term. Right now shareholders are accepting the low P/S as they concede future revenue probably won't provide any pleasant surprises either. Given the current circumstances, it seems unlikely that the share price will experience any significant movement in either direction in the near future if recent medium-term revenue trends persist.
Don't forget that there may be other risks. For instance, we've identified 2 warning signs for Chongqing Sansheng IndustrialLtd that you should be aware of.
Of course, profitable companies with a history of great earnings growth are generally safer bets. So you may wish to see this free collection of other companies that have reasonable P/E ratios and have grown earnings strongly.
New: AI Stock Screener & Alerts
Our new AI Stock Screener scans the market every day to uncover opportunities.
• Dividend Powerhouses (3%+ Yield)
• Undervalued Small Caps with Insider Buying
• High growth Tech and AI Companies
Or build your own from over 50 metrics.
Have feedback on this article? Concerned about the content? Get in touch with us directly. Alternatively, email editorial-team (at) simplywallst.com.
This article by Simply Wall St is general in nature. We provide commentary based on historical data and analyst forecasts only using an unbiased methodology and our articles are not intended to be financial advice. It does not constitute a recommendation to buy or sell any stock, and does not take account of your objectives, or your financial situation. We aim to bring you long-term focused analysis driven by fundamental data. Note that our analysis may not factor in the latest price-sensitive company announcements or qualitative material. Simply Wall St has no position in any stocks mentioned.
About SZSE:002742
Chongqing Sansheng IndustrialLtd
Develops, produces and sells building materials and chemicals in China and internationally.
Slightly overvalued with imperfect balance sheet.
Market Insights

Advertisement
Community Narratives
MicroVision will explode future revenue by 380.37% with a vision towards success
Fair Value US$60.00|98.3% undervalued
TH
Community Contributor
The Indispensable Artery for a New North American Economy
Fair Value CA$132.87|1.0% undervalued
TI
Community Contributor