Subdued Growth No Barrier To Shenzhen Jinjia Group Co.,Ltd. (SZSE:002191) With Shares Advancing 26%

Shenzhen Jinjia Group Co.,Ltd. (SZSE:002191) shares have had a really impressive month, gaining 26% after a shaky period beforehand. Unfortunately, the gains of the last month did little to right the losses of the last year with the stock still down 29% over that time.
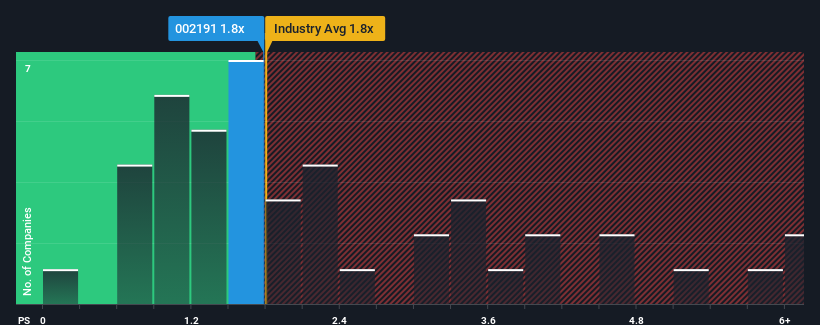
Although its price has surged higher, there still wouldn't be many who think Shenzhen Jinjia GroupLtd's price-to-sales (or "P/S") ratio of 1.8x is worth a mention when it essentially matches the median P/S in China's Packaging industry. Although, it's not wise to simply ignore the P/S without explanation as investors may be disregarding a distinct opportunity or a costly mistake.
View our latest analysis for Shenzhen Jinjia GroupLtd
How Has Shenzhen Jinjia GroupLtd Performed Recently?
Shenzhen Jinjia GroupLtd could be doing better as its revenue has been going backwards lately while most other companies have been seeing positive revenue growth. One possibility is that the P/S ratio is moderate because investors think this poor revenue performance will turn around. However, if this isn't the case, investors might get caught out paying too much for the stock.
If you'd like to see what analysts are forecasting going forward, you should check out our free report on Shenzhen Jinjia GroupLtd.How Is Shenzhen Jinjia GroupLtd's Revenue Growth Trending?
The only time you'd be comfortable seeing a P/S like Shenzhen Jinjia GroupLtd's is when the company's growth is tracking the industry closely.
In reviewing the last year of financials, we were disheartened to see the company's revenues fell to the tune of 26%. This means it has also seen a slide in revenue over the longer-term as revenue is down 28% in total over the last three years. Accordingly, shareholders would have felt downbeat about the medium-term rates of revenue growth.
Shifting to the future, estimates from the sole analyst covering the company suggest revenue growth is heading into negative territory, declining 1.8% over the next year. With the industry predicted to deliver 17% growth, that's a disappointing outcome.
In light of this, it's somewhat alarming that Shenzhen Jinjia GroupLtd's P/S sits in line with the majority of other companies. It seems most investors are hoping for a turnaround in the company's business prospects, but the analyst cohort is not so confident this will happen. Only the boldest would assume these prices are sustainable as these declining revenues are likely to weigh on the share price eventually.
What We Can Learn From Shenzhen Jinjia GroupLtd's P/S?
Shenzhen Jinjia GroupLtd's stock has a lot of momentum behind it lately, which has brought its P/S level with the rest of the industry. We'd say the price-to-sales ratio's power isn't primarily as a valuation instrument but rather to gauge current investor sentiment and future expectations.
It appears that Shenzhen Jinjia GroupLtd currently trades on a higher than expected P/S for a company whose revenues are forecast to decline. With this in mind, we don't feel the current P/S is justified as declining revenues are unlikely to support a more positive sentiment for long. If the poor revenue outlook tells us one thing, it's that these current price levels could be unsustainable.
There are also other vital risk factors to consider and we've discovered 3 warning signs for Shenzhen Jinjia GroupLtd (2 can't be ignored!) that you should be aware of before investing here.
It's important to make sure you look for a great company, not just the first idea you come across. So if growing profitability aligns with your idea of a great company, take a peek at this free list of interesting companies with strong recent earnings growth (and a low P/E).
Mobile Infrastructure for Defense and Disaster
The next wave in robotics isn't humanoid. Its fully autonomous towers delivering 5G, ISR, and radar in under 30 minutes, anywhere.
Get the investor briefing before the next round of contracts
Sponsored On Behalf of CiTechNew: Manage All Your Stock Portfolios in One Place
We've created the ultimate portfolio companion for stock investors, and it's free.
• Connect an unlimited number of Portfolios and see your total in one currency
• Be alerted to new Warning Signs or Risks via email or mobile
• Track the Fair Value of your stocks
Have feedback on this article? Concerned about the content? Get in touch with us directly. Alternatively, email editorial-team (at) simplywallst.com.
This article by Simply Wall St is general in nature. We provide commentary based on historical data and analyst forecasts only using an unbiased methodology and our articles are not intended to be financial advice. It does not constitute a recommendation to buy or sell any stock, and does not take account of your objectives, or your financial situation. We aim to bring you long-term focused analysis driven by fundamental data. Note that our analysis may not factor in the latest price-sensitive company announcements or qualitative material. Simply Wall St has no position in any stocks mentioned.
About SZSE:002191
Shenzhen Jinjia GroupLtd
Engages in the research and development, production, and sale of packaging products and related materials in China.
Good value with adequate balance sheet.
Market Insights

Weekly Picks

Early mover in a fast growing industry. Likely to experience share price volatility as they scale


A case for CA$31.80 (undiluted), aka 8,616% upside from CA$0.37 (an 86 bagger!).


Moderation and Stabilisation: HOLD: Fair Price based on a 4-year Cycle is $12.08
Recently Updated Narratives

Airbnb Stock: Platform Growth in a World of Saturation and Scrutiny

Clarivate Stock: When Data Becomes the Backbone of Innovation and Law

Adobe Stock: AI-Fueled ARR Growth Pushes Guidance Higher, But Cost Pressures Loom
Popular Narratives


Crazy Undervalued 42 Baggers Silver Play (Active & Running Mine)


NVDA: Expanding AI Demand Will Drive Major Data Center Investments Through 2026


MicroVision will explode future revenue by 380.37% with a vision towards success
Trending Discussion
