Stock Analysis
Shenzhen Jinjia GroupLtd (SZSE:002191) sheds CN¥413m, company earnings and investor returns have been trending downwards for past five years


Generally speaking long term investing is the way to go. But that doesn't mean long term investors can avoid big losses. For example the Shenzhen Jinjia Group Co.,Ltd. (SZSE:002191) share price dropped 62% over five years. We certainly feel for shareholders who bought near the top. And we doubt long term believers are the only worried holders, since the stock price has declined 37% over the last twelve months.
Given the past week has been tough on shareholders, let's investigate the fundamentals and see what we can learn.
View our latest analysis for Shenzhen Jinjia GroupLtd
While markets are a powerful pricing mechanism, share prices reflect investor sentiment, not just underlying business performance. One way to examine how market sentiment has changed over time is to look at the interaction between a company's share price and its earnings per share (EPS).
During the five years over which the share price declined, Shenzhen Jinjia GroupLtd's earnings per share (EPS) dropped by 36% each year. This fall in the EPS is worse than the 18% compound annual share price fall. The relatively muted share price reaction might be because the market expects the business to turn around. The high P/E ratio of 79.70 suggests that shareholders believe earnings will grow in the years ahead.
You can see below how EPS has changed over time (discover the exact values by clicking on the image).
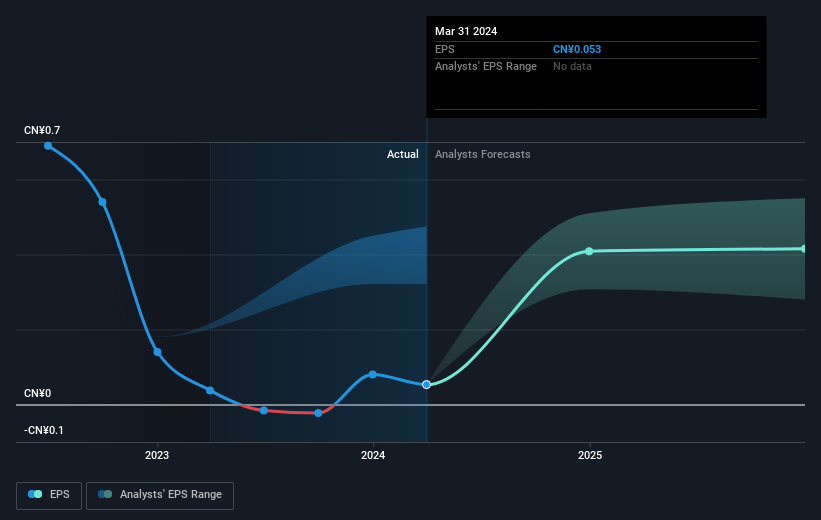
We know that Shenzhen Jinjia GroupLtd has improved its bottom line lately, but is it going to grow revenue? This free report showing analyst revenue forecasts should help you figure out if the EPS growth can be sustained.
What About Dividends?
It is important to consider the total shareholder return, as well as the share price return, for any given stock. The TSR incorporates the value of any spin-offs or discounted capital raisings, along with any dividends, based on the assumption that the dividends are reinvested. It's fair to say that the TSR gives a more complete picture for stocks that pay a dividend. As it happens, Shenzhen Jinjia GroupLtd's TSR for the last 5 years was -55%, which exceeds the share price return mentioned earlier. This is largely a result of its dividend payments!
A Different Perspective
While the broader market lost about 8.9% in the twelve months, Shenzhen Jinjia GroupLtd shareholders did even worse, losing 33% (even including dividends). However, it could simply be that the share price has been impacted by broader market jitters. It might be worth keeping an eye on the fundamentals, in case there's a good opportunity. Unfortunately, last year's performance may indicate unresolved challenges, given that it was worse than the annualised loss of 9% over the last half decade. Generally speaking long term share price weakness can be a bad sign, though contrarian investors might want to research the stock in hope of a turnaround. While it is well worth considering the different impacts that market conditions can have on the share price, there are other factors that are even more important. To that end, you should learn about the 3 warning signs we've spotted with Shenzhen Jinjia GroupLtd (including 2 which are a bit unpleasant) .
If you are like me, then you will not want to miss this free list of undervalued small caps that insiders are buying.
Please note, the market returns quoted in this article reflect the market weighted average returns of stocks that currently trade on Chinese exchanges.
Valuation is complex, but we're helping make it simple.
Find out whether Shenzhen Jinjia GroupLtd is potentially over or undervalued by checking out our comprehensive analysis, which includes fair value estimates, risks and warnings, dividends, insider transactions and financial health.
View the Free AnalysisHave feedback on this article? Concerned about the content? Get in touch with us directly. Alternatively, email editorial-team (at) simplywallst.com.
This article by Simply Wall St is general in nature. We provide commentary based on historical data and analyst forecasts only using an unbiased methodology and our articles are not intended to be financial advice. It does not constitute a recommendation to buy or sell any stock, and does not take account of your objectives, or your financial situation. We aim to bring you long-term focused analysis driven by fundamental data. Note that our analysis may not factor in the latest price-sensitive company announcements or qualitative material. Simply Wall St has no position in any stocks mentioned.
About SZSE:002191
Shenzhen Jinjia GroupLtd
Engages in the research, development, and production of packaging materials in China.
Adequate balance sheet with acceptable track record.
