
Advertisement
Sinocat Environmental Technology Co.,Ltd.'s (SHSE:688737) Shares Leap 25% Yet They're Still Not Telling The Full Story
Those holding Sinocat Environmental Technology Co.,Ltd. (SHSE:688737) shares would be relieved that the share price has rebounded 25% in the last thirty days, but it needs to keep going to repair the recent damage it has caused to investor portfolios. Unfortunately, the gains of the last month did little to right the losses of the last year with the stock still down 20% over that time.
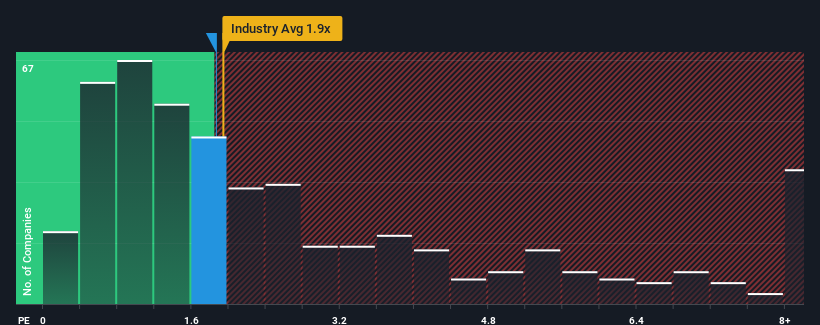
Although its price has surged higher, there still wouldn't be many who think Sinocat Environmental TechnologyLtd's price-to-sales (or "P/S") ratio of 1.9x is worth a mention when it essentially matches the median P/S in China's Chemicals industry. However, investors might be overlooking a clear opportunity or potential setback if there is no rational basis for the P/S.
See our latest analysis for Sinocat Environmental TechnologyLtd
How Sinocat Environmental TechnologyLtd Has Been Performing
Sinocat Environmental TechnologyLtd certainly has been doing a good job lately as it's been growing revenue more than most other companies. One possibility is that the P/S ratio is moderate because investors think this strong revenue performance might be about to tail off. If not, then existing shareholders have reason to be feeling optimistic about the future direction of the share price.
Keen to find out how analysts think Sinocat Environmental TechnologyLtd's future stacks up against the industry? In that case, our free report is a great place to start.How Is Sinocat Environmental TechnologyLtd's Revenue Growth Trending?
There's an inherent assumption that a company should be matching the industry for P/S ratios like Sinocat Environmental TechnologyLtd's to be considered reasonable.
Retrospectively, the last year delivered an exceptional 245% gain to the company's top line. However, this wasn't enough as the latest three year period has seen the company endure a nasty 40% drop in revenue in aggregate. Accordingly, shareholders would have felt downbeat about the medium-term rates of revenue growth.
Turning to the outlook, the next year should generate growth of 119% as estimated by the two analysts watching the company. Meanwhile, the rest of the industry is forecast to only expand by 25%, which is noticeably less attractive.
With this information, we find it interesting that Sinocat Environmental TechnologyLtd is trading at a fairly similar P/S compared to the industry. It may be that most investors aren't convinced the company can achieve future growth expectations.
What We Can Learn From Sinocat Environmental TechnologyLtd's P/S?
Sinocat Environmental TechnologyLtd appears to be back in favour with a solid price jump bringing its P/S back in line with other companies in the industry We'd say the price-to-sales ratio's power isn't primarily as a valuation instrument but rather to gauge current investor sentiment and future expectations.
Looking at Sinocat Environmental TechnologyLtd's analyst forecasts revealed that its superior revenue outlook isn't giving the boost to its P/S that we would've expected. There could be some risks that the market is pricing in, which is preventing the P/S ratio from matching the positive outlook. It appears some are indeed anticipating revenue instability, because these conditions should normally provide a boost to the share price.
You always need to take note of risks, for example - Sinocat Environmental TechnologyLtd has 1 warning sign we think you should be aware of.
It's important to make sure you look for a great company, not just the first idea you come across. So if growing profitability aligns with your idea of a great company, take a peek at this free list of interesting companies with strong recent earnings growth (and a low P/E).
New: Manage All Your Stock Portfolios in One Place
We've created the ultimate portfolio companion for stock investors, and it's free.
• Connect an unlimited number of Portfolios and see your total in one currency
• Be alerted to new Warning Signs or Risks via email or mobile
• Track the Fair Value of your stocks
Have feedback on this article? Concerned about the content? Get in touch with us directly. Alternatively, email editorial-team (at) simplywallst.com.
This article by Simply Wall St is general in nature. We provide commentary based on historical data and analyst forecasts only using an unbiased methodology and our articles are not intended to be financial advice. It does not constitute a recommendation to buy or sell any stock, and does not take account of your objectives, or your financial situation. We aim to bring you long-term focused analysis driven by fundamental data. Note that our analysis may not factor in the latest price-sensitive company announcements or qualitative material. Simply Wall St has no position in any stocks mentioned.
About SHSE:688737
SINOTECH
Operates as a high-tech company, primarily focus on the research and development of new materials and new energy technologies in China.
High growth potential with adequate balance sheet.
Market Insights

Advertisement
Community Narratives
MINISO's fair value is projected at 26.69 with an anticipated PE ratio shift of 20x
Fair Value US$24.03|11.0% undervalued
BE
Community Contributor
Procter & Gamble: A Dividend Giant Facing Slowing Growth
Fair Value US$119.81|23.3% overvalued
AN
Community Contributor
Eli Lilly's Future Growth Driven by Tirzepatide and Favorable Market Conditions
Fair Value US$1.19k|13.8% undervalued
EA
Community Contributor