
Advertisement
Not Many Are Piling Into Guangdong Fangyuan New Materials Group Co., Ltd. (SHSE:688148) Stock Yet As It Plummets 26%
Unfortunately for some shareholders, the Guangdong Fangyuan New Materials Group Co., Ltd. (SHSE:688148) share price has dived 26% in the last thirty days, prolonging recent pain. The recent drop completes a disastrous twelve months for shareholders, who are sitting on a 71% loss during that time.
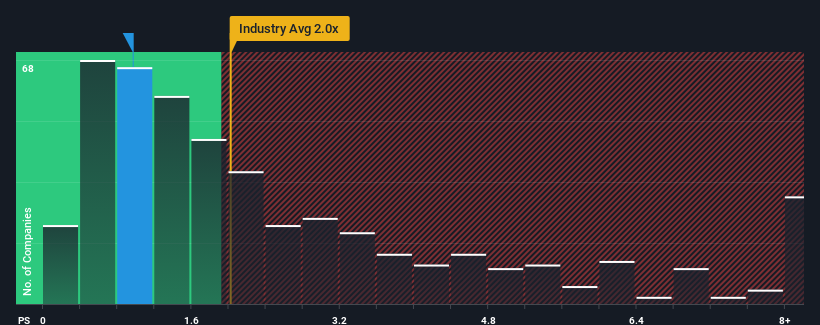
Since its price has dipped substantially, Guangdong Fangyuan New Materials Group's price-to-sales (or "P/S") ratio of 1x might make it look like a buy right now compared to the Chemicals industry in China, where around half of the companies have P/S ratios above 2x and even P/S above 5x are quite common. Nonetheless, we'd need to dig a little deeper to determine if there is a rational basis for the reduced P/S.
See our latest analysis for Guangdong Fangyuan New Materials Group
How Has Guangdong Fangyuan New Materials Group Performed Recently?
For example, consider that Guangdong Fangyuan New Materials Group's financial performance has been poor lately as its revenue has been in decline. It might be that many expect the disappointing revenue performance to continue or accelerate, which has repressed the P/S. If you like the company, you'd be hoping this isn't the case so that you could potentially pick up some stock while it's out of favour.
Want the full picture on earnings, revenue and cash flow for the company? Then our free report on Guangdong Fangyuan New Materials Group will help you shine a light on its historical performance.What Are Revenue Growth Metrics Telling Us About The Low P/S?
There's an inherent assumption that a company should underperform the industry for P/S ratios like Guangdong Fangyuan New Materials Group's to be considered reasonable.
In reviewing the last year of financials, we were disheartened to see the company's revenues fell to the tune of 28%. Even so, admirably revenue has lifted 112% in aggregate from three years ago, notwithstanding the last 12 months. Accordingly, while they would have preferred to keep the run going, shareholders would definitely welcome the medium-term rates of revenue growth.
Comparing that to the industry, which is only predicted to deliver 20% growth in the next 12 months, the company's momentum is stronger based on recent medium-term annualised revenue results.
In light of this, it's peculiar that Guangdong Fangyuan New Materials Group's P/S sits below the majority of other companies. It looks like most investors are not convinced the company can maintain its recent growth rates.
The Final Word
Guangdong Fangyuan New Materials Group's recently weak share price has pulled its P/S back below other Chemicals companies. Generally, our preference is to limit the use of the price-to-sales ratio to establishing what the market thinks about the overall health of a company.
Our examination of Guangdong Fangyuan New Materials Group revealed its three-year revenue trends aren't boosting its P/S anywhere near as much as we would have predicted, given they look better than current industry expectations. Potential investors that are sceptical over continued revenue performance may be preventing the P/S ratio from matching previous strong performance. While recent revenue trends over the past medium-term suggest that the risk of a price decline is low, investors appear to perceive a likelihood of revenue fluctuations in the future.
You need to take note of risks, for example - Guangdong Fangyuan New Materials Group has 3 warning signs (and 2 which shouldn't be ignored) we think you should know about.
If you're unsure about the strength of Guangdong Fangyuan New Materials Group's business, why not explore our interactive list of stocks with solid business fundamentals for some other companies you may have missed.
New: Manage All Your Stock Portfolios in One Place
We've created the ultimate portfolio companion for stock investors, and it's free.
• Connect an unlimited number of Portfolios and see your total in one currency
• Be alerted to new Warning Signs or Risks via email or mobile
• Track the Fair Value of your stocks
Have feedback on this article? Concerned about the content? Get in touch with us directly. Alternatively, email editorial-team (at) simplywallst.com.
This article by Simply Wall St is general in nature. We provide commentary based on historical data and analyst forecasts only using an unbiased methodology and our articles are not intended to be financial advice. It does not constitute a recommendation to buy or sell any stock, and does not take account of your objectives, or your financial situation. We aim to bring you long-term focused analysis driven by fundamental data. Note that our analysis may not factor in the latest price-sensitive company announcements or qualitative material. Simply Wall St has no position in any stocks mentioned.
About SHSE:688148
Guangdong Fangyuan New Materials Group
Guangdong Fangyuan New Materials Group Co., Ltd.
Mediocre balance sheet and slightly overvalued.
Market Insights

Advertisement
Community Narratives
Finding The True Value Of A Logistics Powerhouse
Fair Value US$95.21|8.4% undervalued
NV
Community Contributor
Paradigm Biopharmaceuticals Will Lead Osteoarthritis Treatment with Zilosul's FDA Success
Fair Value AU$5.50|92.1% undervalued
AM
Community Contributor
Barrick Mining (ABX:CA): A Gold Hedge against a U.S. Shutdown
Fair Value CA$60.00|24.2% undervalued
GM
Community Contributor