
Advertisement
Market Participants Recognise Ningbo Changhong Polymer Scientific and Technical Inc.'s (SHSE:605008) Revenues Pushing Shares 35% Higher
Ningbo Changhong Polymer Scientific and Technical Inc. (SHSE:605008) shares have had a really impressive month, gaining 35% after a shaky period beforehand. Looking further back, the 18% rise over the last twelve months isn't too bad notwithstanding the strength over the last 30 days.
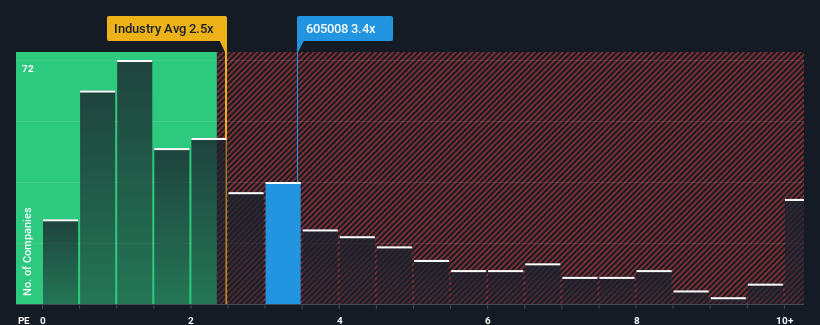
Since its price has surged higher, given close to half the companies operating in China's Chemicals industry have price-to-sales ratios (or "P/S") below 2.5x, you may consider Ningbo Changhong Polymer Scientific and Technical as a stock to potentially avoid with its 3.4x P/S ratio. Although, it's not wise to just take the P/S at face value as there may be an explanation why it's as high as it is.
View our latest analysis for Ningbo Changhong Polymer Scientific and Technical
How Has Ningbo Changhong Polymer Scientific and Technical Performed Recently?
Ningbo Changhong Polymer Scientific and Technical certainly has been doing a good job lately as it's been growing revenue more than most other companies. It seems the market expects this form will continue into the future, hence the elevated P/S ratio. If not, then existing shareholders might be a little nervous about the viability of the share price.
Keen to find out how analysts think Ningbo Changhong Polymer Scientific and Technical's future stacks up against the industry? In that case, our free report is a great place to start.What Are Revenue Growth Metrics Telling Us About The High P/S?
In order to justify its P/S ratio, Ningbo Changhong Polymer Scientific and Technical would need to produce impressive growth in excess of the industry.
Taking a look back first, we see that the company grew revenue by an impressive 98% last year. Pleasingly, revenue has also lifted 65% in aggregate from three years ago, thanks to the last 12 months of growth. So we can start by confirming that the company has done a great job of growing revenue over that time.
Looking ahead now, revenue is anticipated to climb by 29% during the coming year according to the one analyst following the company. With the industry only predicted to deliver 25%, the company is positioned for a stronger revenue result.
In light of this, it's understandable that Ningbo Changhong Polymer Scientific and Technical's P/S sits above the majority of other companies. Apparently shareholders aren't keen to offload something that is potentially eyeing a more prosperous future.
What We Can Learn From Ningbo Changhong Polymer Scientific and Technical's P/S?
Ningbo Changhong Polymer Scientific and Technical shares have taken a big step in a northerly direction, but its P/S is elevated as a result. Typically, we'd caution against reading too much into price-to-sales ratios when settling on investment decisions, though it can reveal plenty about what other market participants think about the company.
As we suspected, our examination of Ningbo Changhong Polymer Scientific and Technical's analyst forecasts revealed that its superior revenue outlook is contributing to its high P/S. It appears that shareholders are confident in the company's future revenues, which is propping up the P/S. It's hard to see the share price falling strongly in the near future under these circumstances.
We don't want to rain on the parade too much, but we did also find 4 warning signs for Ningbo Changhong Polymer Scientific and Technical (2 are significant!) that you need to be mindful of.
If these risks are making you reconsider your opinion on Ningbo Changhong Polymer Scientific and Technical, explore our interactive list of high quality stocks to get an idea of what else is out there.
Valuation is complex, but we're here to simplify it.
Discover if Ningbo Changhong Polymer Scientific and Technical might be undervalued or overvalued with our detailed analysis, featuring fair value estimates, potential risks, dividends, insider trades, and its financial condition.
Access Free AnalysisHave feedback on this article? Concerned about the content? Get in touch with us directly. Alternatively, email editorial-team (at) simplywallst.com.
This article by Simply Wall St is general in nature. We provide commentary based on historical data and analyst forecasts only using an unbiased methodology and our articles are not intended to be financial advice. It does not constitute a recommendation to buy or sell any stock, and does not take account of your objectives, or your financial situation. We aim to bring you long-term focused analysis driven by fundamental data. Note that our analysis may not factor in the latest price-sensitive company announcements or qualitative material. Simply Wall St has no position in any stocks mentioned.
About SHSE:605008
Ningbo Changhong Polymer Scientific and Technical
Ningbo Changhong Polymer Scientific and Technical Inc.
Moderate growth potential with low risk.
Market Insights

Advertisement
Community Narratives
MINISO's fair value is projected at 26.69 with an anticipated PE ratio shift of 20x
Fair Value US$24.03|9.0% undervalued
BE
Community Contributor
Procter & Gamble: A Dividend Giant Facing Slowing Growth
Fair Value US$119.81|23.5% overvalued
AN
Community Contributor
Eli Lilly's Future Growth Driven by Tirzepatide and Favorable Market Conditions
Fair Value US$1.19k|14.4% undervalued
EA
Community Contributor