
Advertisement
Shenzhen Original Advanced Compounds Co., Ltd. (SHSE:603991) Shares May Have Slumped 29% But Getting In Cheap Is Still Unlikely
The Shenzhen Original Advanced Compounds Co., Ltd. (SHSE:603991) share price has fared very poorly over the last month, falling by a substantial 29%. The drop over the last 30 days has capped off a tough year for shareholders, with the share price down 28% in that time.
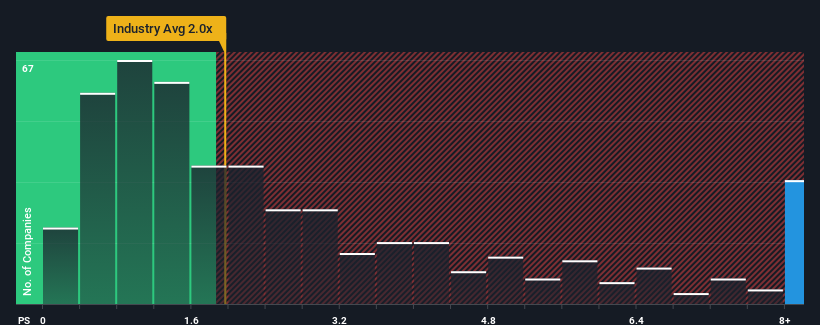
Although its price has dipped substantially, given around half the companies in China's Chemicals industry have price-to-sales ratios (or "P/S") below 2x, you may still consider Shenzhen Original Advanced Compounds as a stock to avoid entirely with its 8.5x P/S ratio. Nonetheless, we'd need to dig a little deeper to determine if there is a rational basis for the highly elevated P/S.
Check out our latest analysis for Shenzhen Original Advanced Compounds
What Does Shenzhen Original Advanced Compounds' P/S Mean For Shareholders?
Shenzhen Original Advanced Compounds certainly has been doing a great job lately as it's been growing its revenue at a really rapid pace. Perhaps the market is expecting future revenue performance to outperform the wider market, which has seemingly got people interested in the stock. You'd really hope so, otherwise you're paying a pretty hefty price for no particular reason.
Although there are no analyst estimates available for Shenzhen Original Advanced Compounds, take a look at this free data-rich visualisation to see how the company stacks up on earnings, revenue and cash flow.How Is Shenzhen Original Advanced Compounds' Revenue Growth Trending?
In order to justify its P/S ratio, Shenzhen Original Advanced Compounds would need to produce outstanding growth that's well in excess of the industry.
If we review the last year of revenue growth, the company posted a terrific increase of 85%. However, this wasn't enough as the latest three year period has seen the company endure a nasty 23% drop in revenue in aggregate. So unfortunately, we have to acknowledge that the company has not done a great job of growing revenues over that time.
Weighing that medium-term revenue trajectory against the broader industry's one-year forecast for expansion of 21% shows it's an unpleasant look.
With this in mind, we find it worrying that Shenzhen Original Advanced Compounds' P/S exceeds that of its industry peers. Apparently many investors in the company are way more bullish than recent times would indicate and aren't willing to let go of their stock at any price. Only the boldest would assume these prices are sustainable as a continuation of recent revenue trends is likely to weigh heavily on the share price eventually.
The Bottom Line On Shenzhen Original Advanced Compounds' P/S
Shenzhen Original Advanced Compounds' shares may have suffered, but its P/S remains high. It's argued the price-to-sales ratio is an inferior measure of value within certain industries, but it can be a powerful business sentiment indicator.
We've established that Shenzhen Original Advanced Compounds currently trades on a much higher than expected P/S since its recent revenues have been in decline over the medium-term. When we see revenue heading backwards and underperforming the industry forecasts, we feel the possibility of the share price declining is very real, bringing the P/S back into the realm of reasonability. If recent medium-term revenue trends continue, it will place shareholders' investments at significant risk and potential investors in danger of paying an excessive premium.
It is also worth noting that we have found 1 warning sign for Shenzhen Original Advanced Compounds that you need to take into consideration.
If strong companies turning a profit tickle your fancy, then you'll want to check out this free list of interesting companies that trade on a low P/E (but have proven they can grow earnings).
New: Manage All Your Stock Portfolios in One Place
We've created the ultimate portfolio companion for stock investors, and it's free.
• Connect an unlimited number of Portfolios and see your total in one currency
• Be alerted to new Warning Signs or Risks via email or mobile
• Track the Fair Value of your stocks
Have feedback on this article? Concerned about the content? Get in touch with us directly. Alternatively, email editorial-team (at) simplywallst.com.
This article by Simply Wall St is general in nature. We provide commentary based on historical data and analyst forecasts only using an unbiased methodology and our articles are not intended to be financial advice. It does not constitute a recommendation to buy or sell any stock, and does not take account of your objectives, or your financial situation. We aim to bring you long-term focused analysis driven by fundamental data. Note that our analysis may not factor in the latest price-sensitive company announcements or qualitative material. Simply Wall St has no position in any stocks mentioned.
About SHSE:603991
Shenzhen Original Advanced Compounds
Shenzhen Original Advanced Compounds Co., Ltd.
Adequate balance sheet with weak fundamentals.
Market Insights

Advertisement
Community Narratives
The company that turned a verb into a global necessity and basically runs the modern internet, digital ads, smartphones, maps, and AI.
Fair Value US$300.00|10.8% undervalued
OS
Community Contributor
Flowers Foods Pays A Fair Price For Health
Fair Value US$16.12|22.0% undervalued
NV
Community Contributor
TMX Group will thrive with 33.3% profit margin and enduring market moat
Fair Value CA$49.90|3.8% overvalued
LI
Community Contributor