
Advertisement
Yongyue Science&Technology Co.,Ltd (SHSE:603879) Stock Rockets 29% As Investors Are Less Pessimistic Than Expected
Yongyue Science&Technology Co.,Ltd (SHSE:603879) shareholders are no doubt pleased to see that the share price has bounced 29% in the last month, although it is still struggling to make up recently lost ground. But the last month did very little to improve the 71% share price decline over the last year.
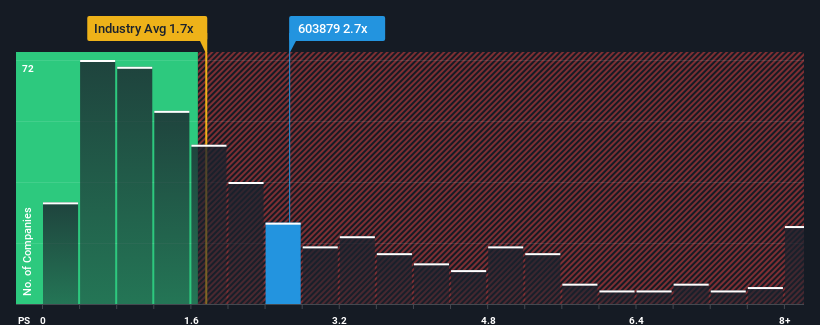
Since its price has surged higher, you could be forgiven for thinking Yongyue Science&TechnologyLtd is a stock not worth researching with a price-to-sales ratios (or "P/S") of 2.7x, considering almost half the companies in China's Chemicals industry have P/S ratios below 1.7x. Nonetheless, we'd need to dig a little deeper to determine if there is a rational basis for the elevated P/S.
Check out our latest analysis for Yongyue Science&TechnologyLtd
How Yongyue Science&TechnologyLtd Has Been Performing
Revenue has risen firmly for Yongyue Science&TechnologyLtd recently, which is pleasing to see. One possibility is that the P/S ratio is high because investors think this respectable revenue growth will be enough to outperform the broader industry in the near future. You'd really hope so, otherwise you're paying a pretty hefty price for no particular reason.
We don't have analyst forecasts, but you can see how recent trends are setting up the company for the future by checking out our free report on Yongyue Science&TechnologyLtd's earnings, revenue and cash flow.How Is Yongyue Science&TechnologyLtd's Revenue Growth Trending?
The only time you'd be truly comfortable seeing a P/S as high as Yongyue Science&TechnologyLtd's is when the company's growth is on track to outshine the industry.
Retrospectively, the last year delivered a decent 13% gain to the company's revenues. Ultimately though, it couldn't turn around the poor performance of the prior period, with revenue shrinking 23% in total over the last three years. Accordingly, shareholders would have felt downbeat about the medium-term rates of revenue growth.
Weighing that medium-term revenue trajectory against the broader industry's one-year forecast for expansion of 24% shows it's an unpleasant look.
With this information, we find it concerning that Yongyue Science&TechnologyLtd is trading at a P/S higher than the industry. Apparently many investors in the company are way more bullish than recent times would indicate and aren't willing to let go of their stock at any price. Only the boldest would assume these prices are sustainable as a continuation of recent revenue trends is likely to weigh heavily on the share price eventually.
The Bottom Line On Yongyue Science&TechnologyLtd's P/S
The large bounce in Yongyue Science&TechnologyLtd's shares has lifted the company's P/S handsomely. We'd say the price-to-sales ratio's power isn't primarily as a valuation instrument but rather to gauge current investor sentiment and future expectations.
We've established that Yongyue Science&TechnologyLtd currently trades on a much higher than expected P/S since its recent revenues have been in decline over the medium-term. Right now we aren't comfortable with the high P/S as this revenue performance is highly unlikely to support such positive sentiment for long. If recent medium-term revenue trends continue, it will place shareholders' investments at significant risk and potential investors in danger of paying an excessive premium.
It's always necessary to consider the ever-present spectre of investment risk. We've identified 2 warning signs with Yongyue Science&TechnologyLtd, and understanding them should be part of your investment process.
If these risks are making you reconsider your opinion on Yongyue Science&TechnologyLtd, explore our interactive list of high quality stocks to get an idea of what else is out there.
New: Manage All Your Stock Portfolios in One Place
We've created the ultimate portfolio companion for stock investors, and it's free.
• Connect an unlimited number of Portfolios and see your total in one currency
• Be alerted to new Warning Signs or Risks via email or mobile
• Track the Fair Value of your stocks
Have feedback on this article? Concerned about the content? Get in touch with us directly. Alternatively, email editorial-team (at) simplywallst.com.
This article by Simply Wall St is general in nature. We provide commentary based on historical data and analyst forecasts only using an unbiased methodology and our articles are not intended to be financial advice. It does not constitute a recommendation to buy or sell any stock, and does not take account of your objectives, or your financial situation. We aim to bring you long-term focused analysis driven by fundamental data. Note that our analysis may not factor in the latest price-sensitive company announcements or qualitative material. Simply Wall St has no position in any stocks mentioned.
Have feedback on this article? Concerned about the content? Get in touch with us directly. Alternatively, email editorial-team@simplywallst.com
About SHSE:603879
Yongyue Science&TechnologyLtd
Engages in the research and development, production, and sale of synthetic resins in China.
Flawless balance sheet with minimal risk.
Market Insights

Advertisement
Community Narratives
MINISO's fair value is projected at 26.69 with an anticipated PE ratio shift of 20x
Fair Value US$24.03|11.0% undervalued
BE
Community Contributor
Procter & Gamble: A Dividend Giant Facing Slowing Growth
Fair Value US$119.81|23.3% overvalued
AN
Community Contributor
Eli Lilly's Future Growth Driven by Tirzepatide and Favorable Market Conditions
Fair Value US$1.19k|13.8% undervalued
EA
Community Contributor