
Advertisement
SKSHU Paint Co.,Ltd.'s (SHSE:603737) 65% Share Price Surge Not Quite Adding Up
SKSHU Paint Co.,Ltd. (SHSE:603737) shares have had a really impressive month, gaining 65% after a shaky period beforehand. Unfortunately, the gains of the last month did little to right the losses of the last year with the stock still down 26% over that time.
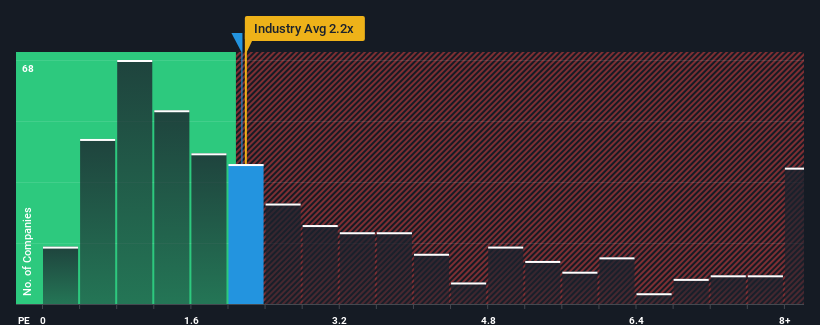
Even after such a large jump in price, it's still not a stretch to say that SKSHU PaintLtd's price-to-sales (or "P/S") ratio of 2.1x right now seems quite "middle-of-the-road" compared to the Chemicals industry in China, where the median P/S ratio is around 2.2x. Although, it's not wise to simply ignore the P/S without explanation as investors may be disregarding a distinct opportunity or a costly mistake.
View our latest analysis for SKSHU PaintLtd
What Does SKSHU PaintLtd's Recent Performance Look Like?
With its revenue growth in positive territory compared to the declining revenue of most other companies, SKSHU PaintLtd has been doing quite well of late. It might be that many expect the strong revenue performance to deteriorate like the rest, which has kept the P/S ratio from rising. If you like the company, you'd be hoping this isn't the case so that you could potentially pick up some stock while it's not quite in favour.
Want the full picture on analyst estimates for the company? Then our free report on SKSHU PaintLtd will help you uncover what's on the horizon.Do Revenue Forecasts Match The P/S Ratio?
The only time you'd be comfortable seeing a P/S like SKSHU PaintLtd's is when the company's growth is tracking the industry closely.
Retrospectively, the last year delivered a decent 6.8% gain to the company's revenues. The latest three year period has also seen an excellent 35% overall rise in revenue, aided somewhat by its short-term performance. Therefore, it's fair to say the revenue growth recently has been superb for the company.
Looking ahead now, revenue is anticipated to climb by 17% during the coming year according to the analysts following the company. That's shaping up to be materially lower than the 23% growth forecast for the broader industry.
With this information, we find it interesting that SKSHU PaintLtd is trading at a fairly similar P/S compared to the industry. It seems most investors are ignoring the fairly limited growth expectations and are willing to pay up for exposure to the stock. These shareholders may be setting themselves up for future disappointment if the P/S falls to levels more in line with the growth outlook.
The Final Word
Its shares have lifted substantially and now SKSHU PaintLtd's P/S is back within range of the industry median. Typically, we'd caution against reading too much into price-to-sales ratios when settling on investment decisions, though it can reveal plenty about what other market participants think about the company.
When you consider that SKSHU PaintLtd's revenue growth estimates are fairly muted compared to the broader industry, it's easy to see why we consider it unexpected to be trading at its current P/S ratio. When we see companies with a relatively weaker revenue outlook compared to the industry, we suspect the share price is at risk of declining, sending the moderate P/S lower. This places shareholders' investments at risk and potential investors in danger of paying an unnecessary premium.
It is also worth noting that we have found 3 warning signs for SKSHU PaintLtd (1 is potentially serious!) that you need to take into consideration.
If these risks are making you reconsider your opinion on SKSHU PaintLtd, explore our interactive list of high quality stocks to get an idea of what else is out there.
New: Manage All Your Stock Portfolios in One Place
We've created the ultimate portfolio companion for stock investors, and it's free.
• Connect an unlimited number of Portfolios and see your total in one currency
• Be alerted to new Warning Signs or Risks via email or mobile
• Track the Fair Value of your stocks
Have feedback on this article? Concerned about the content? Get in touch with us directly. Alternatively, email editorial-team (at) simplywallst.com.
This article by Simply Wall St is general in nature. We provide commentary based on historical data and analyst forecasts only using an unbiased methodology and our articles are not intended to be financial advice. It does not constitute a recommendation to buy or sell any stock, and does not take account of your objectives, or your financial situation. We aim to bring you long-term focused analysis driven by fundamental data. Note that our analysis may not factor in the latest price-sensitive company announcements or qualitative material. Simply Wall St has no position in any stocks mentioned.
About SHSE:603737
SKSHU PaintLtd
Produces and sells paints, coatings, and building materials under the 3trees brand in China.
Solid track record with moderate growth potential.
Market Insights

Advertisement
Community Narratives
MINISO's fair value is projected at 26.69 with an anticipated PE ratio shift of 20x
Fair Value US$24.03|11.0% undervalued
BE
Community Contributor
Procter & Gamble: A Dividend Giant Facing Slowing Growth
Fair Value US$119.81|23.3% overvalued
AN
Community Contributor
Eli Lilly's Future Growth Driven by Tirzepatide and Favorable Market Conditions
Fair Value US$1.19k|13.8% undervalued
EA
Community Contributor