
Advertisement
Revenues Working Against SKSHU Paint Co.,Ltd.'s (SHSE:603737) Share Price Following 25% Dive
SKSHU Paint Co.,Ltd. (SHSE:603737) shareholders won't be pleased to see that the share price has had a very rough month, dropping 25% and undoing the prior period's positive performance. The recent drop completes a disastrous twelve months for shareholders, who are sitting on a 63% loss during that time.
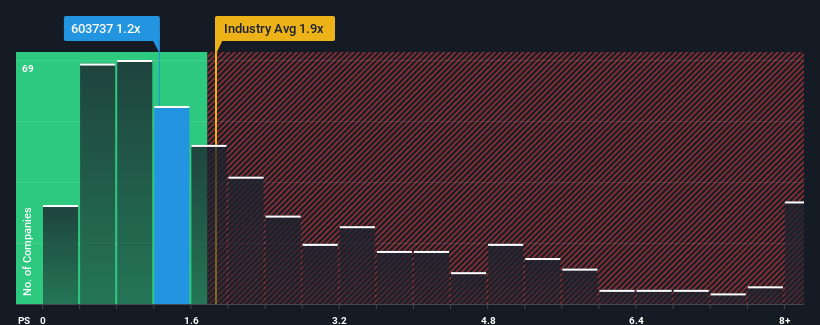
In spite of the heavy fall in price, SKSHU PaintLtd's price-to-sales (or "P/S") ratio of 1.2x might still make it look like a buy right now compared to the Chemicals industry in China, where around half of the companies have P/S ratios above 1.9x and even P/S above 4x are quite common. Nonetheless, we'd need to dig a little deeper to determine if there is a rational basis for the reduced P/S.
See our latest analysis for SKSHU PaintLtd
How Has SKSHU PaintLtd Performed Recently?
Recent revenue growth for SKSHU PaintLtd has been in line with the industry. Perhaps the market is expecting future revenue performance to dive, which has kept the P/S suppressed. If you like the company, you'd be hoping this isn't the case so that you could pick up some stock while it's out of favour.
Keen to find out how analysts think SKSHU PaintLtd's future stacks up against the industry? In that case, our free report is a great place to start.Is There Any Revenue Growth Forecasted For SKSHU PaintLtd?
SKSHU PaintLtd's P/S ratio would be typical for a company that's only expected to deliver limited growth, and importantly, perform worse than the industry.
Taking a look back first, we see that there was hardly any revenue growth to speak of for the company over the past year. Still, the latest three year period was better as it's delivered a decent 21% overall rise in revenue. So it appears to us that the company has had a mixed result in terms of growing revenue over that time.
Turning to the outlook, the next year should generate growth of 14% as estimated by the analysts watching the company. With the industry predicted to deliver 24% growth, the company is positioned for a weaker revenue result.
With this information, we can see why SKSHU PaintLtd is trading at a P/S lower than the industry. Apparently many shareholders weren't comfortable holding on while the company is potentially eyeing a less prosperous future.
The Key Takeaway
SKSHU PaintLtd's recently weak share price has pulled its P/S back below other Chemicals companies. We'd say the price-to-sales ratio's power isn't primarily as a valuation instrument but rather to gauge current investor sentiment and future expectations.
As expected, our analysis of SKSHU PaintLtd's analyst forecasts confirms that the company's underwhelming revenue outlook is a major contributor to its low P/S. At this stage investors feel the potential for an improvement in revenue isn't great enough to justify a higher P/S ratio. Unless these conditions improve, they will continue to form a barrier for the share price around these levels.
It is also worth noting that we have found 4 warning signs for SKSHU PaintLtd that you need to take into consideration.
It's important to make sure you look for a great company, not just the first idea you come across. So if growing profitability aligns with your idea of a great company, take a peek at this free list of interesting companies with strong recent earnings growth (and a low P/E).
New: Manage All Your Stock Portfolios in One Place
We've created the ultimate portfolio companion for stock investors, and it's free.
• Connect an unlimited number of Portfolios and see your total in one currency
• Be alerted to new Warning Signs or Risks via email or mobile
• Track the Fair Value of your stocks
Have feedback on this article? Concerned about the content? Get in touch with us directly. Alternatively, email editorial-team (at) simplywallst.com.
This article by Simply Wall St is general in nature. We provide commentary based on historical data and analyst forecasts only using an unbiased methodology and our articles are not intended to be financial advice. It does not constitute a recommendation to buy or sell any stock, and does not take account of your objectives, or your financial situation. We aim to bring you long-term focused analysis driven by fundamental data. Note that our analysis may not factor in the latest price-sensitive company announcements or qualitative material. Simply Wall St has no position in any stocks mentioned.
Have feedback on this article? Concerned about the content? Get in touch with us directly. Alternatively, email editorial-team@simplywallst.com
About SHSE:603737
SKSHU PaintLtd
Produces and sells paints, coatings, and building materials under the 3trees brand in China.
Solid track record with moderate growth potential.
Market Insights

Advertisement
Community Narratives
MINISO's fair value is projected at 26.69 with an anticipated PE ratio shift of 20x
Fair Value US$24.03|11.0% undervalued
BE
Community Contributor
Procter & Gamble: A Dividend Giant Facing Slowing Growth
Fair Value US$119.81|23.3% overvalued
AN
Community Contributor
Eli Lilly's Future Growth Driven by Tirzepatide and Favorable Market Conditions
Fair Value US$1.19k|13.8% undervalued
EA
Community Contributor