
Advertisement
Guangdong Tianan New Material Co., Ltd.'s (SHSE:603725) Shares Leap 41% Yet They're Still Not Telling The Full Story
Guangdong Tianan New Material Co., Ltd. (SHSE:603725) shareholders are no doubt pleased to see that the share price has bounced 41% in the last month, although it is still struggling to make up recently lost ground. Taking a wider view, although not as strong as the last month, the full year gain of 17% is also fairly reasonable.
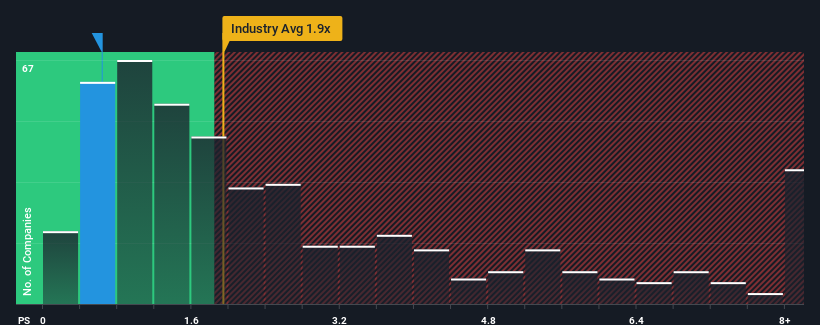
Although its price has surged higher, Guangdong Tianan New Material may still be sending buy signals at present with its price-to-sales (or "P/S") ratio of 0.6x, considering almost half of all companies in the Chemicals industry in China have P/S ratios greater than 1.9x and even P/S higher than 5x aren't out of the ordinary. Nonetheless, we'd need to dig a little deeper to determine if there is a rational basis for the reduced P/S.
View our latest analysis for Guangdong Tianan New Material
How Has Guangdong Tianan New Material Performed Recently?
The revenue growth achieved at Guangdong Tianan New Material over the last year would be more than acceptable for most companies. One possibility is that the P/S is low because investors think this respectable revenue growth might actually underperform the broader industry in the near future. If that doesn't eventuate, then existing shareholders have reason to be optimistic about the future direction of the share price.
Although there are no analyst estimates available for Guangdong Tianan New Material, take a look at this free data-rich visualisation to see how the company stacks up on earnings, revenue and cash flow.What Are Revenue Growth Metrics Telling Us About The Low P/S?
There's an inherent assumption that a company should underperform the industry for P/S ratios like Guangdong Tianan New Material's to be considered reasonable.
Retrospectively, the last year delivered a decent 8.3% gain to the company's revenues. This was backed up an excellent period prior to see revenue up by 267% in total over the last three years. Therefore, it's fair to say the revenue growth recently has been superb for the company.
This is in contrast to the rest of the industry, which is expected to grow by 25% over the next year, materially lower than the company's recent medium-term annualised growth rates.
With this in mind, we find it intriguing that Guangdong Tianan New Material's P/S isn't as high compared to that of its industry peers. It looks like most investors are not convinced the company can maintain its recent growth rates.
The Bottom Line On Guangdong Tianan New Material's P/S
The latest share price surge wasn't enough to lift Guangdong Tianan New Material's P/S close to the industry median. Using the price-to-sales ratio alone to determine if you should sell your stock isn't sensible, however it can be a practical guide to the company's future prospects.
We're very surprised to see Guangdong Tianan New Material currently trading on a much lower than expected P/S since its recent three-year growth is higher than the wider industry forecast. Potential investors that are sceptical over continued revenue performance may be preventing the P/S ratio from matching previous strong performance. At least price risks look to be very low if recent medium-term revenue trends continue, but investors seem to think future revenue could see a lot of volatility.
Having said that, be aware Guangdong Tianan New Material is showing 4 warning signs in our investment analysis, and 2 of those can't be ignored.
If companies with solid past earnings growth is up your alley, you may wish to see this free collection of other companies with strong earnings growth and low P/E ratios.
New: Manage All Your Stock Portfolios in One Place
We've created the ultimate portfolio companion for stock investors, and it's free.
• Connect an unlimited number of Portfolios and see your total in one currency
• Be alerted to new Warning Signs or Risks via email or mobile
• Track the Fair Value of your stocks
Have feedback on this article? Concerned about the content? Get in touch with us directly. Alternatively, email editorial-team (at) simplywallst.com.
This article by Simply Wall St is general in nature. We provide commentary based on historical data and analyst forecasts only using an unbiased methodology and our articles are not intended to be financial advice. It does not constitute a recommendation to buy or sell any stock, and does not take account of your objectives, or your financial situation. We aim to bring you long-term focused analysis driven by fundamental data. Note that our analysis may not factor in the latest price-sensitive company announcements or qualitative material. Simply Wall St has no position in any stocks mentioned.
About SHSE:603725
Guangdong Tianan New Material
Designs, researches, develops, manufactures, and sells polymer composite finishing materials and architectural ceramics in China and internationally.
Mediocre balance sheet second-rate dividend payer.
Market Insights

Advertisement
Community Narratives
Finding The True Value Of A Logistics Powerhouse
Fair Value US$95.21|8.6% undervalued
NV
Community Contributor
Paradigm Biopharmaceuticals Will Lead Osteoarthritis Treatment with Zilosul's FDA Success
Fair Value AU$5.50|91.9% undervalued
AM
Community Contributor
Barrick Mining (ABX:CA): A Gold Hedge against a U.S. Shutdown
Fair Value CA$60.00|25.6% undervalued
GM
Community Contributor