The five-year decline in earnings might be taking its toll on Sanxiang Advanced Materials (SHSE:603663) shareholders as stock falls 7.1% over the past week


It hasn't been the best quarter for Sanxiang Advanced Materials Co., Ltd. (SHSE:603663) shareholders, since the share price has fallen 25% in that time. But that doesn't change the fact that the returns over the last five years have been pleasing. It has returned a market beating 65% in that time.
Although Sanxiang Advanced Materials has shed CN¥428m from its market cap this week, let's take a look at its longer term fundamental trends and see if they've driven returns.
View our latest analysis for Sanxiang Advanced Materials
To paraphrase Benjamin Graham: Over the short term the market is a voting machine, but over the long term it's a weighing machine. One flawed but reasonable way to assess how sentiment around a company has changed is to compare the earnings per share (EPS) with the share price.
Sanxiang Advanced Materials' earnings per share are down 5.1% per year, despite strong share price performance over five years.
Essentially, it doesn't seem likely that investors are focused on EPS. Because earnings per share don't seem to match up with the share price, we'll take a look at other metrics instead.
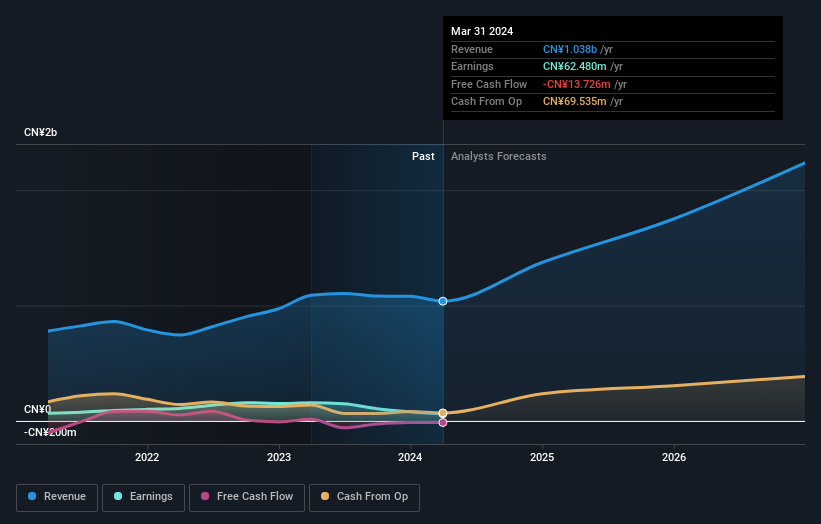
The modest 0.6% dividend yield is unlikely to be propping up the share price. On the other hand, Sanxiang Advanced Materials' revenue is growing nicely, at a compound rate of 11% over the last five years. In that case, the company may be sacrificing current earnings per share to drive growth.
You can see how earnings and revenue have changed over time in the image below (click on the chart to see the exact values).
You can see how its balance sheet has strengthened (or weakened) over time in this free interactive graphic.
What About Dividends?
When looking at investment returns, it is important to consider the difference between total shareholder return (TSR) and share price return. The TSR is a return calculation that accounts for the value of cash dividends (assuming that any dividend received was reinvested) and the calculated value of any discounted capital raisings and spin-offs. It's fair to say that the TSR gives a more complete picture for stocks that pay a dividend. In the case of Sanxiang Advanced Materials, it has a TSR of 70% for the last 5 years. That exceeds its share price return that we previously mentioned. And there's no prize for guessing that the dividend payments largely explain the divergence!
A Different Perspective
We're pleased to report that Sanxiang Advanced Materials shareholders have received a total shareholder return of 24% over one year. Of course, that includes the dividend. That's better than the annualised return of 11% over half a decade, implying that the company is doing better recently. In the best case scenario, this may hint at some real business momentum, implying that now could be a great time to delve deeper. It's always interesting to track share price performance over the longer term. But to understand Sanxiang Advanced Materials better, we need to consider many other factors. Even so, be aware that Sanxiang Advanced Materials is showing 2 warning signs in our investment analysis , you should know about...
If you like to buy stocks alongside management, then you might just love this free list of companies. (Hint: many of them are unnoticed AND have attractive valuation).
Please note, the market returns quoted in this article reflect the market weighted average returns of stocks that currently trade on Chinese exchanges.
New: Manage All Your Stock Portfolios in One Place
We've created the ultimate portfolio companion for stock investors, and it's free.
• Connect an unlimited number of Portfolios and see your total in one currency
• Be alerted to new Warning Signs or Risks via email or mobile
• Track the Fair Value of your stocks
Have feedback on this article? Concerned about the content? Get in touch with us directly. Alternatively, email editorial-team (at) simplywallst.com.
This article by Simply Wall St is general in nature. We provide commentary based on historical data and analyst forecasts only using an unbiased methodology and our articles are not intended to be financial advice. It does not constitute a recommendation to buy or sell any stock, and does not take account of your objectives, or your financial situation. We aim to bring you long-term focused analysis driven by fundamental data. Note that our analysis may not factor in the latest price-sensitive company announcements or qualitative material. Simply Wall St has no position in any stocks mentioned.
Have feedback on this article? Concerned about the content? Get in touch with us directly. Alternatively, email editorial-team@simplywallst.com
About SHSE:603663
Sanxiang Advanced Materials
Engages in the manufacture and sale of fused zirconia, cast modified materials, and single crystal fused aluminum materials.
Adequate balance sheet with limited growth.
