Stock Analysis
The total return for China Kings Resources GroupLtd (SHSE:603505) investors has risen faster than earnings growth over the last five years


We think all investors should try to buy and hold high quality multi-year winners. And we've seen some truly amazing gains over the years. For example, the China Kings Resources Group Co.,Ltd. (SHSE:603505) share price is up a whopping 324% in the last half decade, a handsome return for long term holders. This just goes to show the value creation that some businesses can achieve. It's also good to see the share price up 17% over the last quarter.
In light of the stock dropping 5.5% in the past week, we want to investigate the longer term story, and see if fundamentals have been the driver of the company's positive five-year return.
Check out our latest analysis for China Kings Resources GroupLtd
While the efficient markets hypothesis continues to be taught by some, it has been proven that markets are over-reactive dynamic systems, and investors are not always rational. One way to examine how market sentiment has changed over time is to look at the interaction between a company's share price and its earnings per share (EPS).
Over half a decade, China Kings Resources GroupLtd managed to grow its earnings per share at 20% a year. This EPS growth is lower than the 33% average annual increase in the share price. So it's fair to assume the market has a higher opinion of the business than it did five years ago. That's not necessarily surprising considering the five-year track record of earnings growth. This optimism is visible in its fairly high P/E ratio of 50.85.
You can see below how EPS has changed over time (discover the exact values by clicking on the image).
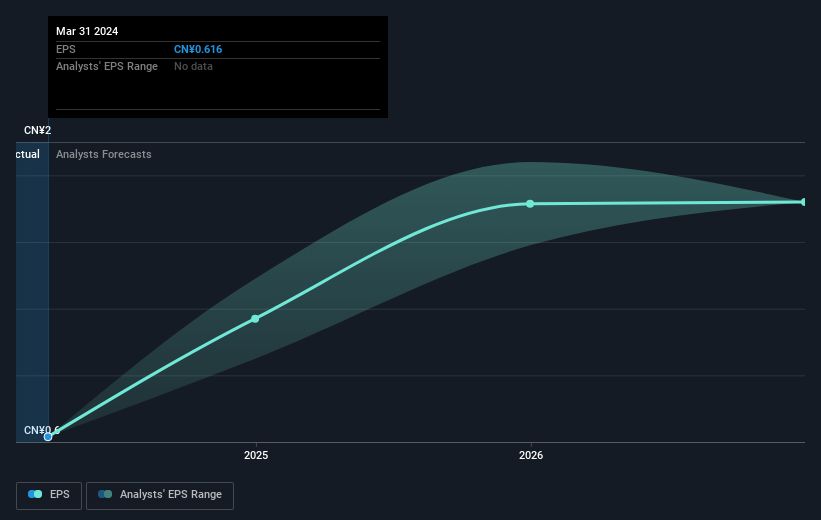
We know that China Kings Resources GroupLtd has improved its bottom line lately, but is it going to grow revenue? If you're interested, you could check this free report showing consensus revenue forecasts.
What About Dividends?
As well as measuring the share price return, investors should also consider the total shareholder return (TSR). The TSR is a return calculation that accounts for the value of cash dividends (assuming that any dividend received was reinvested) and the calculated value of any discounted capital raisings and spin-offs. So for companies that pay a generous dividend, the TSR is often a lot higher than the share price return. We note that for China Kings Resources GroupLtd the TSR over the last 5 years was 343%, which is better than the share price return mentioned above. And there's no prize for guessing that the dividend payments largely explain the divergence!
A Different Perspective
It's good to see that China Kings Resources GroupLtd has rewarded shareholders with a total shareholder return of 34% in the last twelve months. That's including the dividend. However, that falls short of the 35% TSR per annum it has made for shareholders, each year, over five years. While it is well worth considering the different impacts that market conditions can have on the share price, there are other factors that are even more important. For instance, we've identified 3 warning signs for China Kings Resources GroupLtd (2 are concerning) that you should be aware of.
If you like to buy stocks alongside management, then you might just love this free list of companies. (Hint: many of them are unnoticed AND have attractive valuation).
Please note, the market returns quoted in this article reflect the market weighted average returns of stocks that currently trade on Chinese exchanges.
Valuation is complex, but we're helping make it simple.
Find out whether China Kings Resources GroupLtd is potentially over or undervalued by checking out our comprehensive analysis, which includes fair value estimates, risks and warnings, dividends, insider transactions and financial health.
View the Free AnalysisHave feedback on this article? Concerned about the content? Get in touch with us directly. Alternatively, email editorial-team (at) simplywallst.com.
This article by Simply Wall St is general in nature. We provide commentary based on historical data and analyst forecasts only using an unbiased methodology and our articles are not intended to be financial advice. It does not constitute a recommendation to buy or sell any stock, and does not take account of your objectives, or your financial situation. We aim to bring you long-term focused analysis driven by fundamental data. Note that our analysis may not factor in the latest price-sensitive company announcements or qualitative material. Simply Wall St has no position in any stocks mentioned.
About SHSE:603505
China Kings Resources GroupLtd
Invests in and develops fluorite mines in the People’s Republic of China.
Exceptional growth potential and fair value.
