Xinjiang Xuefeng Sci-Tech(Group)Co.Ltd (SHSE:603227) jumps 7.4% this week, though earnings growth is still tracking behind five-year shareholder returns


Generally speaking the aim of active stock picking is to find companies that provide returns that are superior to the market average. And in our experience, buying the right stocks can give your wealth a significant boost. For example, long term Xinjiang Xuefeng Sci-Tech(Group)Co.,Ltd (SHSE:603227) shareholders have enjoyed a 88% share price rise over the last half decade, well in excess of the market return of around 2.8% (not including dividends).
On the back of a solid 7-day performance, let's check what role the company's fundamentals have played in driving long term shareholder returns.
View our latest analysis for Xinjiang Xuefeng Sci-Tech(Group)Co.Ltd
To paraphrase Benjamin Graham: Over the short term the market is a voting machine, but over the long term it's a weighing machine. One imperfect but simple way to consider how the market perception of a company has shifted is to compare the change in the earnings per share (EPS) with the share price movement.
During five years of share price growth, Xinjiang Xuefeng Sci-Tech(Group)Co.Ltd achieved compound earnings per share (EPS) growth of 56% per year. This EPS growth is higher than the 14% average annual increase in the share price. So it seems the market isn't so enthusiastic about the stock these days. This cautious sentiment is reflected in its (fairly low) P/E ratio of 9.99.
The graphic below depicts how EPS has changed over time (unveil the exact values by clicking on the image).
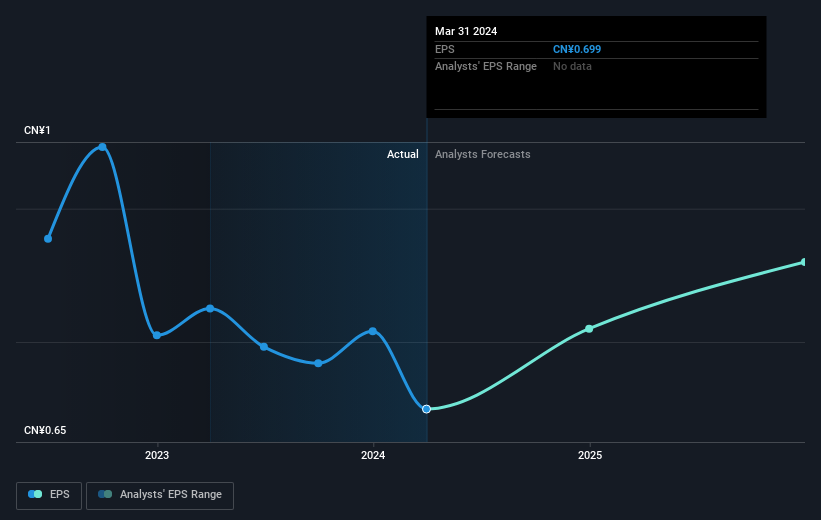
We know that Xinjiang Xuefeng Sci-Tech(Group)Co.Ltd has improved its bottom line over the last three years, but what does the future have in store? If you are thinking of buying or selling Xinjiang Xuefeng Sci-Tech(Group)Co.Ltd stock, you should check out this FREE detailed report on its balance sheet.
What About Dividends?
As well as measuring the share price return, investors should also consider the total shareholder return (TSR). Whereas the share price return only reflects the change in the share price, the TSR includes the value of dividends (assuming they were reinvested) and the benefit of any discounted capital raising or spin-off. Arguably, the TSR gives a more comprehensive picture of the return generated by a stock. In the case of Xinjiang Xuefeng Sci-Tech(Group)Co.Ltd, it has a TSR of 105% for the last 5 years. That exceeds its share price return that we previously mentioned. And there's no prize for guessing that the dividend payments largely explain the divergence!
A Different Perspective
Although it hurts that Xinjiang Xuefeng Sci-Tech(Group)Co.Ltd returned a loss of 15% in the last twelve months, the broader market was actually worse, returning a loss of 19%. Longer term investors wouldn't be so upset, since they would have made 15%, each year, over five years. It could be that the business is just facing some short term problems, but shareholders should keep a close eye on the fundamentals. It's always interesting to track share price performance over the longer term. But to understand Xinjiang Xuefeng Sci-Tech(Group)Co.Ltd better, we need to consider many other factors. Consider for instance, the ever-present spectre of investment risk. We've identified 1 warning sign with Xinjiang Xuefeng Sci-Tech(Group)Co.Ltd , and understanding them should be part of your investment process.
If you are like me, then you will not want to miss this free list of undervalued small caps that insiders are buying.
Please note, the market returns quoted in this article reflect the market weighted average returns of stocks that currently trade on Chinese exchanges.
New: AI Stock Screener & Alerts
Our new AI Stock Screener scans the market every day to uncover opportunities.
• Dividend Powerhouses (3%+ Yield)
• Undervalued Small Caps with Insider Buying
• High growth Tech and AI Companies
Or build your own from over 50 metrics.
Have feedback on this article? Concerned about the content? Get in touch with us directly. Alternatively, email editorial-team (at) simplywallst.com.
This article by Simply Wall St is general in nature. We provide commentary based on historical data and analyst forecasts only using an unbiased methodology and our articles are not intended to be financial advice. It does not constitute a recommendation to buy or sell any stock, and does not take account of your objectives, or your financial situation. We aim to bring you long-term focused analysis driven by fundamental data. Note that our analysis may not factor in the latest price-sensitive company announcements or qualitative material. Simply Wall St has no position in any stocks mentioned.
Have feedback on this article? Concerned about the content? Get in touch with us directly. Alternatively, email editorial-team@simplywallst.com
About SHSE:603227
Xinjiang Xuefeng Sci-Tech(Group)Co.Ltd
Engages in the research and development, production, and sale of civil explosives.
Flawless balance sheet, undervalued and pays a dividend.
