
Advertisement
- China
- /
- Metals and Mining
- /
- SHSE:601609
Calculating The Intrinsic Value Of Ningbo Jintian Copper (Group) Co., Ltd. (SHSE:601609)
Key Insights
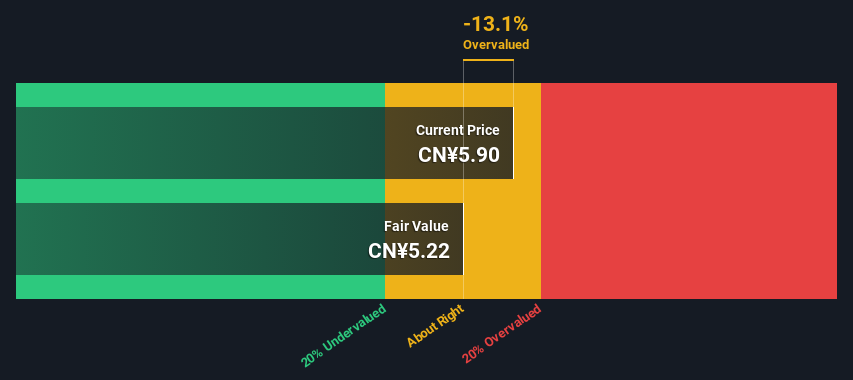
- The projected fair value for Ningbo Jintian Copper (Group) is CN¥5.22 based on 2 Stage Free Cash Flow to Equity
- Ningbo Jintian Copper (Group)'s CN¥5.90 share price indicates it is trading at similar levels as its fair value estimate
- Ningbo Jintian Copper (Group)'s peers seem to be trading at a higher premium to fair value based onthe industry average of -2,362%
Today we will run through one way of estimating the intrinsic value of Ningbo Jintian Copper (Group) Co., Ltd. (SHSE:601609) by projecting its future cash flows and then discounting them to today's value. This will be done using the Discounted Cash Flow (DCF) model. Models like these may appear beyond the comprehension of a lay person, but they're fairly easy to follow.
Remember though, that there are many ways to estimate a company's value, and a DCF is just one method. Anyone interested in learning a bit more about intrinsic value should have a read of the Simply Wall St analysis model.
View our latest analysis for Ningbo Jintian Copper (Group)
What's The Estimated Valuation?
We're using the 2-stage growth model, which simply means we take in account two stages of company's growth. In the initial period the company may have a higher growth rate and the second stage is usually assumed to have a stable growth rate. To begin with, we have to get estimates of the next ten years of cash flows. Where possible we use analyst estimates, but when these aren't available we extrapolate the previous free cash flow (FCF) from the last estimate or reported value. We assume companies with shrinking free cash flow will slow their rate of shrinkage, and that companies with growing free cash flow will see their growth rate slow, over this period. We do this to reflect that growth tends to slow more in the early years than it does in later years.
A DCF is all about the idea that a dollar in the future is less valuable than a dollar today, so we need to discount the sum of these future cash flows to arrive at a present value estimate:
10-year free cash flow (FCF) estimate
| 2024 | 2025 | 2026 | 2027 | 2028 | 2029 | 2030 | 2031 | 2032 | 2033 | |
| Levered FCF (CN¥, Millions) | CN¥296.0m | CN¥605.0m | CN¥761.0m | CN¥879.6m | CN¥983.3m | CN¥1.07b | CN¥1.15b | CN¥1.22b | CN¥1.28b | CN¥1.34b |
| Growth Rate Estimate Source | Analyst x1 | Analyst x1 | Analyst x1 | Est @ 15.59% | Est @ 11.78% | Est @ 9.12% | Est @ 7.25% | Est @ 5.95% | Est @ 5.03% | Est @ 4.39% |
| Present Value (CN¥, Millions) Discounted @ 14% | CN¥259 | CN¥464 | CN¥511 | CN¥518 | CN¥507 | CN¥485 | CN¥455 | CN¥423 | CN¥389 | CN¥356 |
("Est" = FCF growth rate estimated by Simply Wall St)
Present Value of 10-year Cash Flow (PVCF) = CN¥4.4b
We now need to calculate the Terminal Value, which accounts for all the future cash flows after this ten year period. For a number of reasons a very conservative growth rate is used that cannot exceed that of a country's GDP growth. In this case we have used the 5-year average of the 10-year government bond yield (2.9%) to estimate future growth. In the same way as with the 10-year 'growth' period, we discount future cash flows to today's value, using a cost of equity of 14%.
Terminal Value (TV)= FCF2033 × (1 + g) ÷ (r – g) = CN¥1.3b× (1 + 2.9%) ÷ (14%– 2.9%) = CN¥12b
Present Value of Terminal Value (PVTV)= TV / (1 + r)10= CN¥12b÷ ( 1 + 14%)10= CN¥3.2b
The total value, or equity value, is then the sum of the present value of the future cash flows, which in this case is CN¥7.6b. In the final step we divide the equity value by the number of shares outstanding. Compared to the current share price of CN¥5.9, the company appears around fair value at the time of writing. Valuations are imprecise instruments though, rather like a telescope - move a few degrees and end up in a different galaxy. Do keep this in mind.
Important Assumptions
The calculation above is very dependent on two assumptions. The first is the discount rate and the other is the cash flows. You don't have to agree with these inputs, I recommend redoing the calculations yourself and playing with them. The DCF also does not consider the possible cyclicality of an industry, or a company's future capital requirements, so it does not give a full picture of a company's potential performance. Given that we are looking at Ningbo Jintian Copper (Group) as potential shareholders, the cost of equity is used as the discount rate, rather than the cost of capital (or weighted average cost of capital, WACC) which accounts for debt. In this calculation we've used 14%, which is based on a levered beta of 2.000. Beta is a measure of a stock's volatility, compared to the market as a whole. We get our beta from the industry average beta of globally comparable companies, with an imposed limit between 0.8 and 2.0, which is a reasonable range for a stable business.
SWOT Analysis for Ningbo Jintian Copper (Group)
Strength
- Earnings growth over the past year exceeded the industry.
- Debt is well covered by .
Weakness
- Interest payments on debt are not well covered.
- Dividend is low compared to the top 25% of dividend payers in the Metals and Mining market.
Opportunity
- Annual earnings are forecast to grow for the next 3 years.
- Good value based on P/E ratio compared to estimated Fair P/E ratio.
Threat
- Debt is not well covered by operating cash flow.
- Paying a dividend but company has no free cash flows.
Next Steps:
Valuation is only one side of the coin in terms of building your investment thesis, and it shouldn't be the only metric you look at when researching a company. It's not possible to obtain a foolproof valuation with a DCF model. Rather it should be seen as a guide to "what assumptions need to be true for this stock to be under/overvalued?" If a company grows at a different rate, or if its cost of equity or risk free rate changes sharply, the output can look very different. For Ningbo Jintian Copper (Group), there are three fundamental elements you should explore:
- Risks: Be aware that Ningbo Jintian Copper (Group) is showing 2 warning signs in our investment analysis , and 1 of those shouldn't be ignored...
- Future Earnings: How does 601609's growth rate compare to its peers and the wider market? Dig deeper into the analyst consensus number for the upcoming years by interacting with our free analyst growth expectation chart.
- Other Solid Businesses: Low debt, high returns on equity and good past performance are fundamental to a strong business. Why not explore our interactive list of stocks with solid business fundamentals to see if there are other companies you may not have considered!
PS. Simply Wall St updates its DCF calculation for every Chinese stock every day, so if you want to find the intrinsic value of any other stock just search here.
Valuation is complex, but we're here to simplify it.
Discover if Ningbo Jintian Copper (Group) might be undervalued or overvalued with our detailed analysis, featuring fair value estimates, potential risks, dividends, insider trades, and its financial condition.
Access Free AnalysisHave feedback on this article? Concerned about the content? Get in touch with us directly. Alternatively, email editorial-team (at) simplywallst.com.
This article by Simply Wall St is general in nature. We provide commentary based on historical data and analyst forecasts only using an unbiased methodology and our articles are not intended to be financial advice. It does not constitute a recommendation to buy or sell any stock, and does not take account of your objectives, or your financial situation. We aim to bring you long-term focused analysis driven by fundamental data. Note that our analysis may not factor in the latest price-sensitive company announcements or qualitative material. Simply Wall St has no position in any stocks mentioned.
About SHSE:601609
Ningbo Jintian Copper (Group)
Manufactures and sells copper-based products in China and internationally.
Proven track record with slight risk.
Market Insights

Advertisement
Community Narratives
MINISO's fair value is projected at 26.69 with an anticipated PE ratio shift of 20x
Fair Value US$24.03|11.0% undervalued
BE
Community Contributor
Procter & Gamble: A Dividend Giant Facing Slowing Growth
Fair Value US$119.81|23.3% overvalued
AN
Community Contributor
Eli Lilly's Future Growth Driven by Tirzepatide and Favorable Market Conditions
Fair Value US$1.19k|13.8% undervalued
EA
Community Contributor