
Advertisement
- China
- /
- Metals and Mining
- /
- SHSE:601137
Does This Valuation Of Ningbo Boway Alloy Material Company Limited (SHSE:601137) Imply Investors Are Overpaying?
Key Insights
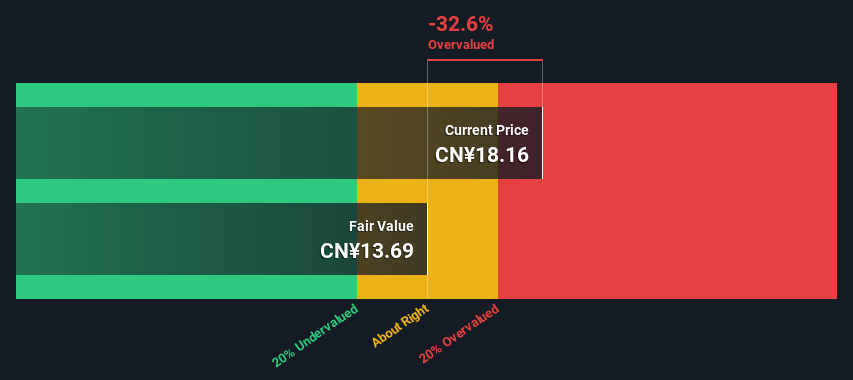
- The projected fair value for Ningbo Boway Alloy Material is CN¥13.69 based on 2 Stage Free Cash Flow to Equity
- Ningbo Boway Alloy Material is estimated to be 33% overvalued based on current share price of CN¥18.16
- Analyst price target for 601137 is CN¥22.07, which is 61% above our fair value estimate
In this article we are going to estimate the intrinsic value of Ningbo Boway Alloy Material Company Limited (SHSE:601137) by projecting its future cash flows and then discounting them to today's value. This will be done using the Discounted Cash Flow (DCF) model. Models like these may appear beyond the comprehension of a lay person, but they're fairly easy to follow.
We would caution that there are many ways of valuing a company and, like the DCF, each technique has advantages and disadvantages in certain scenarios. For those who are keen learners of equity analysis, the Simply Wall St analysis model here may be something of interest to you.
View our latest analysis for Ningbo Boway Alloy Material
The Calculation
We are going to use a two-stage DCF model, which, as the name states, takes into account two stages of growth. The first stage is generally a higher growth period which levels off heading towards the terminal value, captured in the second 'steady growth' period. To start off with, we need to estimate the next ten years of cash flows. Where possible we use analyst estimates, but when these aren't available we extrapolate the previous free cash flow (FCF) from the last estimate or reported value. We assume companies with shrinking free cash flow will slow their rate of shrinkage, and that companies with growing free cash flow will see their growth rate slow, over this period. We do this to reflect that growth tends to slow more in the early years than it does in later years.
A DCF is all about the idea that a dollar in the future is less valuable than a dollar today, and so the sum of these future cash flows is then discounted to today's value:
10-year free cash flow (FCF) estimate
| 2024 | 2025 | 2026 | 2027 | 2028 | 2029 | 2030 | 2031 | 2032 | 2033 | |
| Levered FCF (CN¥, Millions) | CN¥454.0m | CN¥2.24b | CN¥1.53b | CN¥1.17b | CN¥986.5m | CN¥887.7m | CN¥833.2m | CN¥804.7m | CN¥792.4m | CN¥790.8m |
| Growth Rate Estimate Source | Analyst x1 | Analyst x1 | Analyst x1 | Est @ -23.45% | Est @ -15.55% | Est @ -10.01% | Est @ -6.14% | Est @ -3.43% | Est @ -1.53% | Est @ -0.20% |
| Present Value (CN¥, Millions) Discounted @ 10% | CN¥411 | CN¥1.8k | CN¥1.1k | CN¥786 | CN¥601 | CN¥490 | CN¥417 | CN¥365 | CN¥325 | CN¥294 |
("Est" = FCF growth rate estimated by Simply Wall St)
Present Value of 10-year Cash Flow (PVCF) = CN¥6.7b
The second stage is also known as Terminal Value, this is the business's cash flow after the first stage. The Gordon Growth formula is used to calculate Terminal Value at a future annual growth rate equal to the 5-year average of the 10-year government bond yield of 2.9%. We discount the terminal cash flows to today's value at a cost of equity of 10%.
Terminal Value (TV)= FCF2033 × (1 + g) ÷ (r – g) = CN¥791m× (1 + 2.9%) ÷ (10%– 2.9%) = CN¥11b
Present Value of Terminal Value (PVTV)= TV / (1 + r)10= CN¥11b÷ ( 1 + 10%)10= CN¥4.0b
The total value, or equity value, is then the sum of the present value of the future cash flows, which in this case is CN¥11b. In the final step we divide the equity value by the number of shares outstanding. Relative to the current share price of CN¥18.2, the company appears potentially overvalued at the time of writing. The assumptions in any calculation have a big impact on the valuation, so it is better to view this as a rough estimate, not precise down to the last cent.
The Assumptions
We would point out that the most important inputs to a discounted cash flow are the discount rate and of course the actual cash flows. Part of investing is coming up with your own evaluation of a company's future performance, so try the calculation yourself and check your own assumptions. The DCF also does not consider the possible cyclicality of an industry, or a company's future capital requirements, so it does not give a full picture of a company's potential performance. Given that we are looking at Ningbo Boway Alloy Material as potential shareholders, the cost of equity is used as the discount rate, rather than the cost of capital (or weighted average cost of capital, WACC) which accounts for debt. In this calculation we've used 10%, which is based on a levered beta of 1.333. Beta is a measure of a stock's volatility, compared to the market as a whole. We get our beta from the industry average beta of globally comparable companies, with an imposed limit between 0.8 and 2.0, which is a reasonable range for a stable business.
SWOT Analysis for Ningbo Boway Alloy Material
Strength
- Earnings growth over the past year exceeded the industry.
- Debt is not viewed as a risk.
- Dividend is in the top 25% of dividend payers in the market.
Weakness
- No major weaknesses identified for 601137.
Opportunity
- Annual earnings are forecast to grow for the next 3 years.
- Good value based on P/E ratio compared to estimated Fair P/E ratio.
Threat
- Dividends are not covered by cash flow.
- Annual earnings are forecast to grow slower than the Chinese market.
Looking Ahead:
Valuation is only one side of the coin in terms of building your investment thesis, and it is only one of many factors that you need to assess for a company. It's not possible to obtain a foolproof valuation with a DCF model. Preferably you'd apply different cases and assumptions and see how they would impact the company's valuation. If a company grows at a different rate, or if its cost of equity or risk free rate changes sharply, the output can look very different. Can we work out why the company is trading at a premium to intrinsic value? For Ningbo Boway Alloy Material, there are three relevant aspects you should further examine:
- Risks: Every company has them, and we've spotted 2 warning signs for Ningbo Boway Alloy Material you should know about.
- Future Earnings: How does 601137's growth rate compare to its peers and the wider market? Dig deeper into the analyst consensus number for the upcoming years by interacting with our free analyst growth expectation chart.
- Other High Quality Alternatives: Do you like a good all-rounder? Explore our interactive list of high quality stocks to get an idea of what else is out there you may be missing!
PS. Simply Wall St updates its DCF calculation for every Chinese stock every day, so if you want to find the intrinsic value of any other stock just search here.
Valuation is complex, but we're here to simplify it.
Discover if Ningbo Boway Alloy Material might be undervalued or overvalued with our detailed analysis, featuring fair value estimates, potential risks, dividends, insider trades, and its financial condition.
Access Free AnalysisHave feedback on this article? Concerned about the content? Get in touch with us directly. Alternatively, email editorial-team (at) simplywallst.com.
This article by Simply Wall St is general in nature. We provide commentary based on historical data and analyst forecasts only using an unbiased methodology and our articles are not intended to be financial advice. It does not constitute a recommendation to buy or sell any stock, and does not take account of your objectives, or your financial situation. We aim to bring you long-term focused analysis driven by fundamental data. Note that our analysis may not factor in the latest price-sensitive company announcements or qualitative material. Simply Wall St has no position in any stocks mentioned.
About SHSE:601137
Ningbo Boway Alloy Material
Researches, develops, manufactures, and sells non-ferrous alloy materials in Asia, Europe, North America, and internationally.
Undervalued average dividend payer.
Market Insights

Advertisement
Community Narratives
MINISO's fair value is projected at 26.69 with an anticipated PE ratio shift of 20x
Fair Value US$24.03|11.0% undervalued
BE
Community Contributor
Procter & Gamble: A Dividend Giant Facing Slowing Growth
Fair Value US$119.81|23.3% overvalued
AN
Community Contributor
Eli Lilly's Future Growth Driven by Tirzepatide and Favorable Market Conditions
Fair Value US$1.19k|13.8% undervalued
EA
Community Contributor