Stock Analysis
Zhejiang Xinan Chemical Industrial GroupLtd's (SHSE:600596 three-year decrease in earnings delivers investors with a 48% loss


As an investor its worth striving to ensure your overall portfolio beats the market average. But in any portfolio, there are likely to be some stocks that fall short of that benchmark. Unfortunately, that's been the case for longer term Zhejiang Xinan Chemical Industrial Group Co.,Ltd (SHSE:600596) shareholders, since the share price is down 53% in the last three years, falling well short of the market decline of around 25%. And more recent buyers are having a tough time too, with a drop of 37% in the last year. Shareholders have had an even rougher run lately, with the share price down 10% in the last 90 days. Of course, this share price action may well have been influenced by the 4.1% decline in the broader market, throughout the period.
After losing 3.8% this past week, it's worth investigating the company's fundamentals to see what we can infer from past performance.
See our latest analysis for Zhejiang Xinan Chemical Industrial GroupLtd
To quote Buffett, 'Ships will sail around the world but the Flat Earth Society will flourish. There will continue to be wide discrepancies between price and value in the marketplace...' One imperfect but simple way to consider how the market perception of a company has shifted is to compare the change in the earnings per share (EPS) with the share price movement.
During the three years that the share price fell, Zhejiang Xinan Chemical Industrial GroupLtd's earnings per share (EPS) dropped by 48% each year. In comparison the 22% compound annual share price decline isn't as bad as the EPS drop-off. So, despite the prior disappointment, shareholders must have some confidence the situation will improve, longer term. This positive sentiment is also reflected in the generous P/E ratio of 68.29.
You can see below how EPS has changed over time (discover the exact values by clicking on the image).
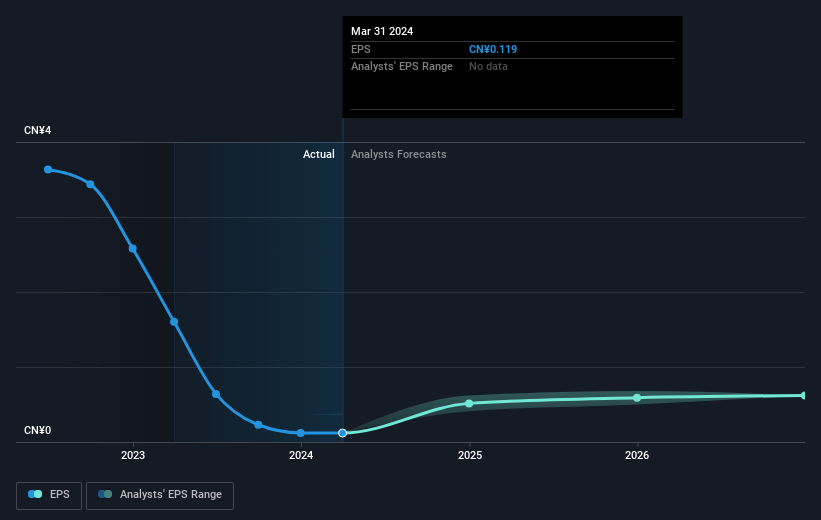
This free interactive report on Zhejiang Xinan Chemical Industrial GroupLtd's earnings, revenue and cash flow is a great place to start, if you want to investigate the stock further.
What About Dividends?
It is important to consider the total shareholder return, as well as the share price return, for any given stock. Whereas the share price return only reflects the change in the share price, the TSR includes the value of dividends (assuming they were reinvested) and the benefit of any discounted capital raising or spin-off. So for companies that pay a generous dividend, the TSR is often a lot higher than the share price return. In the case of Zhejiang Xinan Chemical Industrial GroupLtd, it has a TSR of -48% for the last 3 years. That exceeds its share price return that we previously mentioned. And there's no prize for guessing that the dividend payments largely explain the divergence!
A Different Perspective
While the broader market lost about 15% in the twelve months, Zhejiang Xinan Chemical Industrial GroupLtd shareholders did even worse, losing 36% (even including dividends). Having said that, it's inevitable that some stocks will be oversold in a falling market. The key is to keep your eyes on the fundamental developments. On the bright side, long term shareholders have made money, with a gain of 2% per year over half a decade. If the fundamental data continues to indicate long term sustainable growth, the current sell-off could be an opportunity worth considering. I find it very interesting to look at share price over the long term as a proxy for business performance. But to truly gain insight, we need to consider other information, too. Case in point: We've spotted 4 warning signs for Zhejiang Xinan Chemical Industrial GroupLtd you should be aware of.
If you would prefer to check out another company -- one with potentially superior financials -- then do not miss this free list of companies that have proven they can grow earnings.
Please note, the market returns quoted in this article reflect the market weighted average returns of stocks that currently trade on Chinese exchanges.
Valuation is complex, but we're here to simplify it.
Discover if Zhejiang Xinan Chemical Industrial GroupLtd might be undervalued or overvalued with our detailed analysis, featuring fair value estimates, potential risks, dividends, insider trades, and its financial condition.
Access Free AnalysisHave feedback on this article? Concerned about the content? Get in touch with us directly. Alternatively, email editorial-team (at) simplywallst.com.
This article by Simply Wall St is general in nature. We provide commentary based on historical data and analyst forecasts only using an unbiased methodology and our articles are not intended to be financial advice. It does not constitute a recommendation to buy or sell any stock, and does not take account of your objectives, or your financial situation. We aim to bring you long-term focused analysis driven by fundamental data. Note that our analysis may not factor in the latest price-sensitive company announcements or qualitative material. Simply Wall St has no position in any stocks mentioned.
Have feedback on this article? Concerned about the content? Get in touch with us directly. Alternatively, email editorial-team@simplywallst.com
About SHSE:600596
Zhejiang Xinan Chemical Industrial GroupLtd
Develops, manufactures, and sells chemical products for plant protection in China and internationally.
Adequate balance sheet slight.
