
Advertisement
- China
- /
- Metals and Mining
- /
- SHSE:600408
Improved Revenues Required Before Shanxi Antai Group Co.,Ltd (SHSE:600408) Stock's 28% Jump Looks Justified

Shanxi Antai Group Co.,Ltd (SHSE:600408) shareholders would be excited to see that the share price has had a great month, posting a 28% gain and recovering from prior weakness. Unfortunately, the gains of the last month did little to right the losses of the last year with the stock still down 24% over that time.
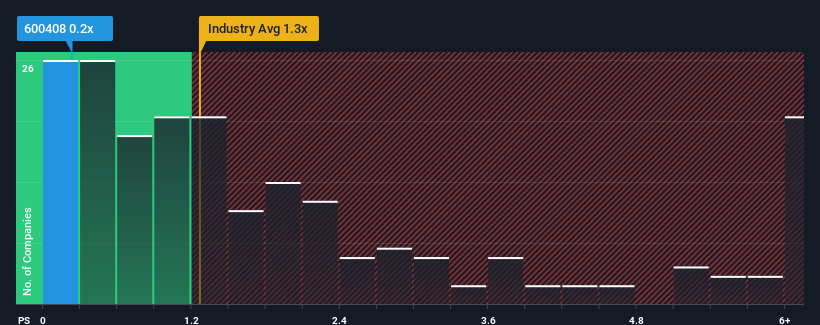
In spite of the firm bounce in price, considering around half the companies operating in China's Metals and Mining industry have price-to-sales ratios (or "P/S") above 1.3x, you may still consider Shanxi Antai GroupLtd as an solid investment opportunity with its 0.2x P/S ratio. However, the P/S might be low for a reason and it requires further investigation to determine if it's justified.
Check out our latest analysis for Shanxi Antai GroupLtd
How Shanxi Antai GroupLtd Has Been Performing
For instance, Shanxi Antai GroupLtd's receding revenue in recent times would have to be some food for thought. One possibility is that the P/S is low because investors think the company won't do enough to avoid underperforming the broader industry in the near future. However, if this doesn't eventuate then existing shareholders may be feeling optimistic about the future direction of the share price.
Although there are no analyst estimates available for Shanxi Antai GroupLtd, take a look at this free data-rich visualisation to see how the company stacks up on earnings, revenue and cash flow.Is There Any Revenue Growth Forecasted For Shanxi Antai GroupLtd?
The only time you'd be truly comfortable seeing a P/S as low as Shanxi Antai GroupLtd's is when the company's growth is on track to lag the industry.
Retrospectively, the last year delivered a frustrating 22% decrease to the company's top line. This means it has also seen a slide in revenue over the longer-term as revenue is down 21% in total over the last three years. So unfortunately, we have to acknowledge that the company has not done a great job of growing revenue over that time.
In contrast to the company, the rest of the industry is expected to grow by 13% over the next year, which really puts the company's recent medium-term revenue decline into perspective.
With this information, we are not surprised that Shanxi Antai GroupLtd is trading at a P/S lower than the industry. Nonetheless, there's no guarantee the P/S has reached a floor yet with revenue going in reverse. There's potential for the P/S to fall to even lower levels if the company doesn't improve its top-line growth.
What We Can Learn From Shanxi Antai GroupLtd's P/S?
The latest share price surge wasn't enough to lift Shanxi Antai GroupLtd's P/S close to the industry median. Generally, our preference is to limit the use of the price-to-sales ratio to establishing what the market thinks about the overall health of a company.
Our examination of Shanxi Antai GroupLtd confirms that the company's shrinking revenue over the past medium-term is a key factor in its low price-to-sales ratio, given the industry is projected to grow. Right now shareholders are accepting the low P/S as they concede future revenue probably won't provide any pleasant surprises either. Given the current circumstances, it seems unlikely that the share price will experience any significant movement in either direction in the near future if recent medium-term revenue trends persist.
There are also other vital risk factors to consider before investing and we've discovered 1 warning sign for Shanxi Antai GroupLtd that you should be aware of.
If companies with solid past earnings growth is up your alley, you may wish to see this free collection of other companies with strong earnings growth and low P/E ratios.
New: Manage All Your Stock Portfolios in One Place
We've created the ultimate portfolio companion for stock investors, and it's free.
• Connect an unlimited number of Portfolios and see your total in one currency
• Be alerted to new Warning Signs or Risks via email or mobile
• Track the Fair Value of your stocks
Have feedback on this article? Concerned about the content? Get in touch with us directly. Alternatively, email editorial-team (at) simplywallst.com.
This article by Simply Wall St is general in nature. We provide commentary based on historical data and analyst forecasts only using an unbiased methodology and our articles are not intended to be financial advice. It does not constitute a recommendation to buy or sell any stock, and does not take account of your objectives, or your financial situation. We aim to bring you long-term focused analysis driven by fundamental data. Note that our analysis may not factor in the latest price-sensitive company announcements or qualitative material. Simply Wall St has no position in any stocks mentioned.
About SHSE:600408
Shanxi Antai GroupLtd
Engages in the production and sale of coke and steel products in China.
Mediocre balance sheet and slightly overvalued.
Market Insights


Advertisement
Community Narratives
A case for TSXV:USA to reach USD $5.00 - $9.00 (CAD $7.30–$12.29) by 2029.
Fair Value CA$12.29|91.1% undervalued
AG
Community Contributor
DLocal's Future Growth Fueled by 35% Revenue and Profit Margin Boosts
Fair Value US$195.39|94.2% undervalued
WY
Community Contributor
Historically Cheap, but the Margin of Safety Is Still Thin
Fair Value SEK 232.58|13.2% undervalued
MA
Community Contributor