Shareholders 23% loss in CNSIG Inner Mongolia Chemical IndustryLtd (SHSE:600328) partly attributable to the company's decline in earnings over past year


The simplest way to benefit from a rising market is to buy an index fund. But if you buy individual stocks, you can do both better or worse than that. That downside risk was realized by CNSIG Inner Mongolia Chemical Industry Co.,Ltd. (SHSE:600328) shareholders over the last year, as the share price declined 26%. That's disappointing when you consider the market declined 8.7%. The silver lining (for longer term investors) is that the stock is still 9.4% higher than it was three years ago.
Although the past week has been more reassuring for shareholders, they're still in the red over the last year, so let's see if the underlying business has been responsible for the decline.
View our latest analysis for CNSIG Inner Mongolia Chemical IndustryLtd
In his essay The Superinvestors of Graham-and-Doddsville Warren Buffett described how share prices do not always rationally reflect the value of a business. One way to examine how market sentiment has changed over time is to look at the interaction between a company's share price and its earnings per share (EPS).
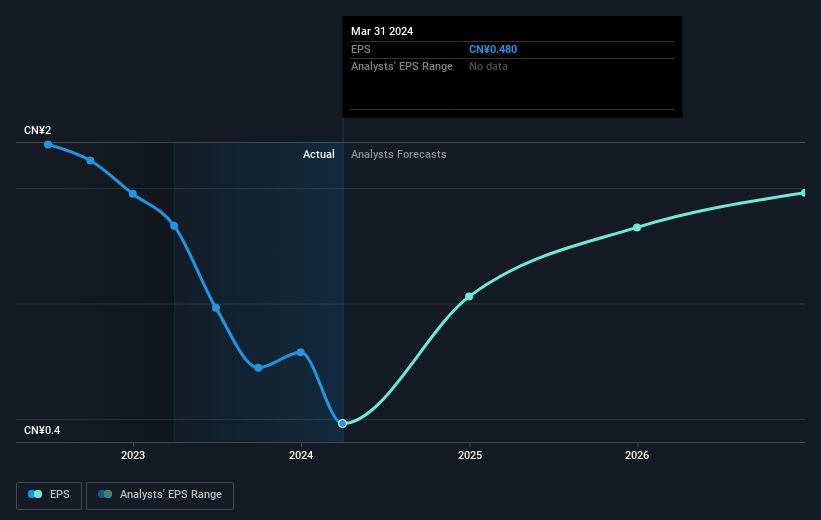
Unhappily, CNSIG Inner Mongolia Chemical IndustryLtd had to report a 64% decline in EPS over the last year. This fall in the EPS is significantly worse than the 26% the share price fall. So despite the weak per-share profits, some investors are probably relieved the situation wasn't more difficult.
The image below shows how EPS has tracked over time (if you click on the image you can see greater detail).
Before buying or selling a stock, we always recommend a close examination of historic growth trends, available here.
What About Dividends?
When looking at investment returns, it is important to consider the difference between total shareholder return (TSR) and share price return. The TSR incorporates the value of any spin-offs or discounted capital raisings, along with any dividends, based on the assumption that the dividends are reinvested. So for companies that pay a generous dividend, the TSR is often a lot higher than the share price return. In the case of CNSIG Inner Mongolia Chemical IndustryLtd, it has a TSR of -23% for the last 1 year. That exceeds its share price return that we previously mentioned. The dividends paid by the company have thusly boosted the total shareholder return.
A Different Perspective
We regret to report that CNSIG Inner Mongolia Chemical IndustryLtd shareholders are down 23% for the year (even including dividends). Unfortunately, that's worse than the broader market decline of 8.7%. However, it could simply be that the share price has been impacted by broader market jitters. It might be worth keeping an eye on the fundamentals, in case there's a good opportunity. On the bright side, long term shareholders have made money, with a gain of 7% per year over half a decade. It could be that the recent sell-off is an opportunity, so it may be worth checking the fundamental data for signs of a long term growth trend. It's always interesting to track share price performance over the longer term. But to understand CNSIG Inner Mongolia Chemical IndustryLtd better, we need to consider many other factors. Take risks, for example - CNSIG Inner Mongolia Chemical IndustryLtd has 2 warning signs we think you should be aware of.
If you like to buy stocks alongside management, then you might just love this free list of companies. (Hint: insiders have been buying them).
Please note, the market returns quoted in this article reflect the market weighted average returns of stocks that currently trade on Chinese exchanges.
New: AI Stock Screener & Alerts
Our new AI Stock Screener scans the market every day to uncover opportunities.
• Dividend Powerhouses (3%+ Yield)
• Undervalued Small Caps with Insider Buying
• High growth Tech and AI Companies
Or build your own from over 50 metrics.
Have feedback on this article? Concerned about the content? Get in touch with us directly. Alternatively, email editorial-team (at) simplywallst.com.
This article by Simply Wall St is general in nature. We provide commentary based on historical data and analyst forecasts only using an unbiased methodology and our articles are not intended to be financial advice. It does not constitute a recommendation to buy or sell any stock, and does not take account of your objectives, or your financial situation. We aim to bring you long-term focused analysis driven by fundamental data. Note that our analysis may not factor in the latest price-sensitive company announcements or qualitative material. Simply Wall St has no position in any stocks mentioned.
About SHSE:600328
CNSIG Inner Mongolia Chemical IndustryLtd
CNSIG Inner Mongolia Chemical Industry Co.,Ltd.
Excellent balance sheet average dividend payer.
