- China
- /
- Metals and Mining
- /
- SHSE:600295
Inner Mongolia ERDOS ResourcesLtd (SHSE:600295) shareholders have earned a 24% CAGR over the last five years


While Inner Mongolia ERDOS Resources Co.,Ltd. (SHSE:600295) shareholders are probably generally happy, the stock hasn't had particularly good run recently, with the share price falling 24% in the last quarter. But that scarcely detracts from the really solid long term returns generated by the company over five years. We think most investors would be happy with the 111% return, over that period. So while it's never fun to see a share price fall, it's important to look at a longer time horizon. The more important question is whether the stock is too cheap or too expensive today. While the returns over the last 5 years have been good, we do feel sorry for those shareholders who haven't held shares that long, because the share price is down 59% in the last three years.
Let's take a look at the underlying fundamentals over the longer term, and see if they've been consistent with shareholders returns.
View our latest analysis for Inner Mongolia ERDOS ResourcesLtd
To quote Buffett, 'Ships will sail around the world but the Flat Earth Society will flourish. There will continue to be wide discrepancies between price and value in the marketplace...' By comparing earnings per share (EPS) and share price changes over time, we can get a feel for how investor attitudes to a company have morphed over time.
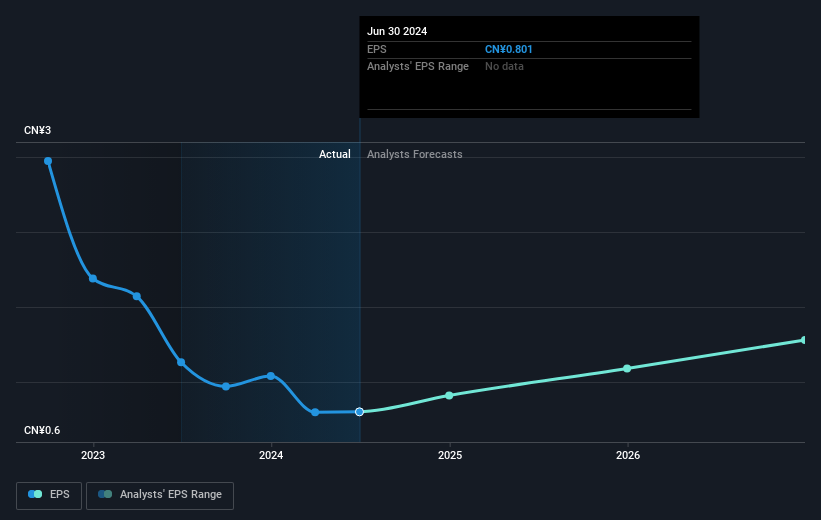
During five years of share price growth, Inner Mongolia ERDOS ResourcesLtd achieved compound earnings per share (EPS) growth of 6.9% per year. This EPS growth is lower than the 16% average annual increase in the share price. So it's fair to assume the market has a higher opinion of the business than it did five years ago. That's not necessarily surprising considering the five-year track record of earnings growth.
The graphic below depicts how EPS has changed over time (unveil the exact values by clicking on the image).
Before buying or selling a stock, we always recommend a close examination of historic growth trends, available here.
What About Dividends?
When looking at investment returns, it is important to consider the difference between total shareholder return (TSR) and share price return. Whereas the share price return only reflects the change in the share price, the TSR includes the value of dividends (assuming they were reinvested) and the benefit of any discounted capital raising or spin-off. Arguably, the TSR gives a more comprehensive picture of the return generated by a stock. As it happens, Inner Mongolia ERDOS ResourcesLtd's TSR for the last 5 years was 188%, which exceeds the share price return mentioned earlier. This is largely a result of its dividend payments!
A Different Perspective
While it's certainly disappointing to see that Inner Mongolia ERDOS ResourcesLtd shares lost 3.1% throughout the year, that wasn't as bad as the market loss of 19%. Of course, the long term returns are far more important and the good news is that over five years, the stock has returned 24% for each year. In the best case scenario the last year is just a temporary blip on the journey to a brighter future. It's always interesting to track share price performance over the longer term. But to understand Inner Mongolia ERDOS ResourcesLtd better, we need to consider many other factors. Take risks, for example - Inner Mongolia ERDOS ResourcesLtd has 1 warning sign we think you should be aware of.
For those who like to find winning investments this free list of undervalued companies with recent insider purchasing, could be just the ticket.
Please note, the market returns quoted in this article reflect the market weighted average returns of stocks that currently trade on Chinese exchanges.
New: AI Stock Screener & Alerts
Our new AI Stock Screener scans the market every day to uncover opportunities.
• Dividend Powerhouses (3%+ Yield)
• Undervalued Small Caps with Insider Buying
• High growth Tech and AI Companies
Or build your own from over 50 metrics.
Have feedback on this article? Concerned about the content? Get in touch with us directly. Alternatively, email editorial-team (at) simplywallst.com.
This article by Simply Wall St is general in nature. We provide commentary based on historical data and analyst forecasts only using an unbiased methodology and our articles are not intended to be financial advice. It does not constitute a recommendation to buy or sell any stock, and does not take account of your objectives, or your financial situation. We aim to bring you long-term focused analysis driven by fundamental data. Note that our analysis may not factor in the latest price-sensitive company announcements or qualitative material. Simply Wall St has no position in any stocks mentioned.
About SHSE:600295
Inner Mongolia ERDOS ResourcesLtd
Inner Mongolia Erdos Resources Co.,ltd. engages in garment, energy, chemical, metallurgy, and other businesses in China.
Excellent balance sheet average dividend payer.
