
Advertisement
Guizhou Chitianhua Co.,Ltd. (SHSE:600227) Not Doing Enough For Some Investors As Its Shares Slump 28%

The Guizhou Chitianhua Co.,Ltd. (SHSE:600227) share price has fared very poorly over the last month, falling by a substantial 28%. For any long-term shareholders, the last month ends a year to forget by locking in a 52% share price decline.
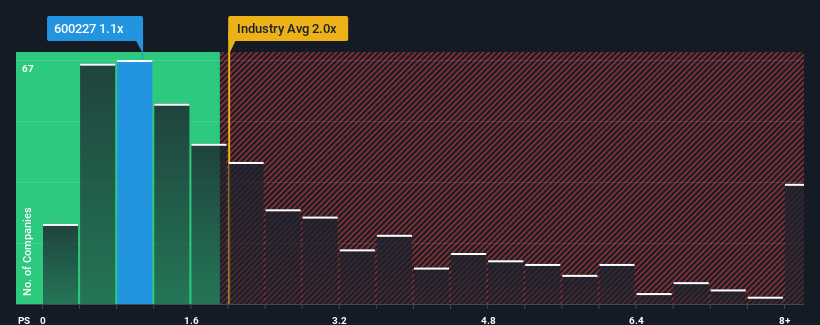
Since its price has dipped substantially, Guizhou ChitianhuaLtd may be sending buy signals at present with its price-to-sales (or "P/S") ratio of 1.1x, considering almost half of all companies in the Chemicals industry in China have P/S ratios greater than 2x and even P/S higher than 4x aren't out of the ordinary. However, the P/S might be low for a reason and it requires further investigation to determine if it's justified.
Check out our latest analysis for Guizhou ChitianhuaLtd
What Does Guizhou ChitianhuaLtd's P/S Mean For Shareholders?
For instance, Guizhou ChitianhuaLtd's receding revenue in recent times would have to be some food for thought. It might be that many expect the disappointing revenue performance to continue or accelerate, which has repressed the P/S. If you like the company, you'd be hoping this isn't the case so that you could potentially pick up some stock while it's out of favour.
We don't have analyst forecasts, but you can see how recent trends are setting up the company for the future by checking out our free report on Guizhou ChitianhuaLtd's earnings, revenue and cash flow.How Is Guizhou ChitianhuaLtd's Revenue Growth Trending?
The only time you'd be truly comfortable seeing a P/S as low as Guizhou ChitianhuaLtd's is when the company's growth is on track to lag the industry.
In reviewing the last year of financials, we were disheartened to see the company's revenues fell to the tune of 10%. That put a dampener on the good run it was having over the longer-term as its three-year revenue growth is still a noteworthy 5.1% in total. So we can start by confirming that the company has generally done a good job of growing revenue over that time, even though it had some hiccups along the way.
Comparing that to the industry, which is predicted to deliver 23% growth in the next 12 months, the company's momentum is weaker, based on recent medium-term annualised revenue results.
In light of this, it's understandable that Guizhou ChitianhuaLtd's P/S sits below the majority of other companies. Apparently many shareholders weren't comfortable holding on to something they believe will continue to trail the wider industry.
What We Can Learn From Guizhou ChitianhuaLtd's P/S?
The southerly movements of Guizhou ChitianhuaLtd's shares means its P/S is now sitting at a pretty low level. We'd say the price-to-sales ratio's power isn't primarily as a valuation instrument but rather to gauge current investor sentiment and future expectations.
Our examination of Guizhou ChitianhuaLtd confirms that the company's revenue trends over the past three-year years are a key factor in its low price-to-sales ratio, as we suspected, given they fall short of current industry expectations. At this stage investors feel the potential for an improvement in revenue isn't great enough to justify a higher P/S ratio. If recent medium-term revenue trends continue, it's hard to see the share price experience a reversal of fortunes anytime soon.
Many other vital risk factors can be found on the company's balance sheet. Take a look at our free balance sheet analysis for Guizhou ChitianhuaLtd with six simple checks on some of these key factors.
If you're unsure about the strength of Guizhou ChitianhuaLtd's business, why not explore our interactive list of stocks with solid business fundamentals for some other companies you may have missed.
New: Manage All Your Stock Portfolios in One Place
We've created the ultimate portfolio companion for stock investors, and it's free.
• Connect an unlimited number of Portfolios and see your total in one currency
• Be alerted to new Warning Signs or Risks via email or mobile
• Track the Fair Value of your stocks
Have feedback on this article? Concerned about the content? Get in touch with us directly. Alternatively, email editorial-team (at) simplywallst.com.
This article by Simply Wall St is general in nature. We provide commentary based on historical data and analyst forecasts only using an unbiased methodology and our articles are not intended to be financial advice. It does not constitute a recommendation to buy or sell any stock, and does not take account of your objectives, or your financial situation. We aim to bring you long-term focused analysis driven by fundamental data. Note that our analysis may not factor in the latest price-sensitive company announcements or qualitative material. Simply Wall St has no position in any stocks mentioned.
About SHSE:600227
Guizhou ChitianhuaLtd
Engages in the chemical and pharmaceutical businesses in China.
Adequate balance sheet and fair value.
Market Insights


Advertisement
Community Narratives
MicroStrategy: Volatile Gamble or Golden Opportunity?
Fair Value US$663.00|31.2% undervalued
BL
Community Contributor
Emerging Markets and Debt Reduction Will Propel Bath & Body Works Forward
Fair Value US$40.73|24.4% undervalued
ZW
Community Contributor
An amazing opportunity to potentially get a 100 bagger
Fair Value US$10.00|13.5% overvalued
DA
Community Contributor