
Advertisement
Some Investors May Be Worried About Anhui Wanwei Updated High-Tech Material IndustryLtd's (SHSE:600063) Returns On Capital
If you're not sure where to start when looking for the next multi-bagger, there are a few key trends you should keep an eye out for. Amongst other things, we'll want to see two things; firstly, a growing return on capital employed (ROCE) and secondly, an expansion in the company's amount of capital employed. If you see this, it typically means it's a company with a great business model and plenty of profitable reinvestment opportunities. Although, when we looked at Anhui Wanwei Updated High-Tech Material IndustryLtd (SHSE:600063), it didn't seem to tick all of these boxes.
Return On Capital Employed (ROCE): What Is It?
Just to clarify if you're unsure, ROCE is a metric for evaluating how much pre-tax income (in percentage terms) a company earns on the capital invested in its business. The formula for this calculation on Anhui Wanwei Updated High-Tech Material IndustryLtd is:
Return on Capital Employed = Earnings Before Interest and Tax (EBIT) ÷ (Total Assets - Current Liabilities)
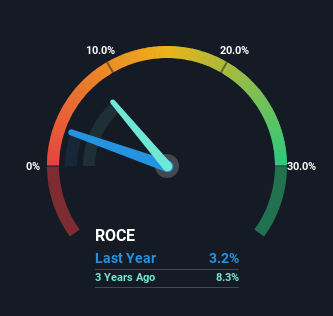
0.032 = CN¥282m ÷ (CN¥15b - CN¥6.0b) (Based on the trailing twelve months to September 2023).
Thus, Anhui Wanwei Updated High-Tech Material IndustryLtd has an ROCE of 3.2%. In absolute terms, that's a low return and it also under-performs the Chemicals industry average of 5.7%.
View our latest analysis for Anhui Wanwei Updated High-Tech Material IndustryLtd
In the above chart we have measured Anhui Wanwei Updated High-Tech Material IndustryLtd's prior ROCE against its prior performance, but the future is arguably more important. If you'd like to see what analysts are forecasting going forward, you should check out our free analyst report for Anhui Wanwei Updated High-Tech Material IndustryLtd .
What The Trend Of ROCE Can Tell Us
On the surface, the trend of ROCE at Anhui Wanwei Updated High-Tech Material IndustryLtd doesn't inspire confidence. Around five years ago the returns on capital were 4.3%, but since then they've fallen to 3.2%. However it looks like Anhui Wanwei Updated High-Tech Material IndustryLtd might be reinvesting for long term growth because while capital employed has increased, the company's sales haven't changed much in the last 12 months. It's worth keeping an eye on the company's earnings from here on to see if these investments do end up contributing to the bottom line.
Another thing to note, Anhui Wanwei Updated High-Tech Material IndustryLtd has a high ratio of current liabilities to total assets of 41%. This can bring about some risks because the company is basically operating with a rather large reliance on its suppliers or other sorts of short-term creditors. Ideally we'd like to see this reduce as that would mean fewer obligations bearing risks.
The Key Takeaway
Bringing it all together, while we're somewhat encouraged by Anhui Wanwei Updated High-Tech Material IndustryLtd's reinvestment in its own business, we're aware that returns are shrinking. And investors may be recognizing these trends since the stock has only returned a total of 32% to shareholders over the last five years. As a result, if you're hunting for a multi-bagger, we think you'd have more luck elsewhere.
On a separate note, we've found 3 warning signs for Anhui Wanwei Updated High-Tech Material IndustryLtd you'll probably want to know about.
If you want to search for solid companies with great earnings, check out this free list of companies with good balance sheets and impressive returns on equity.
New: Manage All Your Stock Portfolios in One Place
We've created the ultimate portfolio companion for stock investors, and it's free.
• Connect an unlimited number of Portfolios and see your total in one currency
• Be alerted to new Warning Signs or Risks via email or mobile
• Track the Fair Value of your stocks
Have feedback on this article? Concerned about the content? Get in touch with us directly. Alternatively, email editorial-team (at) simplywallst.com.
This article by Simply Wall St is general in nature. We provide commentary based on historical data and analyst forecasts only using an unbiased methodology and our articles are not intended to be financial advice. It does not constitute a recommendation to buy or sell any stock, and does not take account of your objectives, or your financial situation. We aim to bring you long-term focused analysis driven by fundamental data. Note that our analysis may not factor in the latest price-sensitive company announcements or qualitative material. Simply Wall St has no position in any stocks mentioned.
About SHSE:600063
Anhui Wanwei Updated High-Tech Material IndustryLtd
Provides chemicals, chemical fibers, and building materials.
Proven track record and fair value.
Market Insights

Advertisement
Community Narratives
Finding The True Value Of A Logistics Powerhouse
Fair Value US$95.21|8.4% undervalued
NV
Community Contributor
Paradigm Biopharmaceuticals Will Lead Osteoarthritis Treatment with Zilosul's FDA Success
Fair Value AU$5.50|92.1% undervalued
AM
Community Contributor
Barrick Mining (ABX:CA): A Gold Hedge against a U.S. Shutdown
Fair Value CA$60.00|24.2% undervalued
GM
Community Contributor