Anhui Wanwei Updated High-Tech Material IndustryLtd (SHSE:600063) Seems To Be Using A Lot Of Debt

Some say volatility, rather than debt, is the best way to think about risk as an investor, but Warren Buffett famously said that 'Volatility is far from synonymous with risk.' It's only natural to consider a company's balance sheet when you examine how risky it is, since debt is often involved when a business collapses. We can see that Anhui Wanwei Updated High-Tech Material Industry Co.,Ltd (SHSE:600063) does use debt in its business. But the real question is whether this debt is making the company risky.
Why Does Debt Bring Risk?
Debt is a tool to help businesses grow, but if a business is incapable of paying off its lenders, then it exists at their mercy. Ultimately, if the company can't fulfill its legal obligations to repay debt, shareholders could walk away with nothing. However, a more usual (but still expensive) situation is where a company must dilute shareholders at a cheap share price simply to get debt under control. Having said that, the most common situation is where a company manages its debt reasonably well - and to its own advantage. The first step when considering a company's debt levels is to consider its cash and debt together.
See our latest analysis for Anhui Wanwei Updated High-Tech Material IndustryLtd
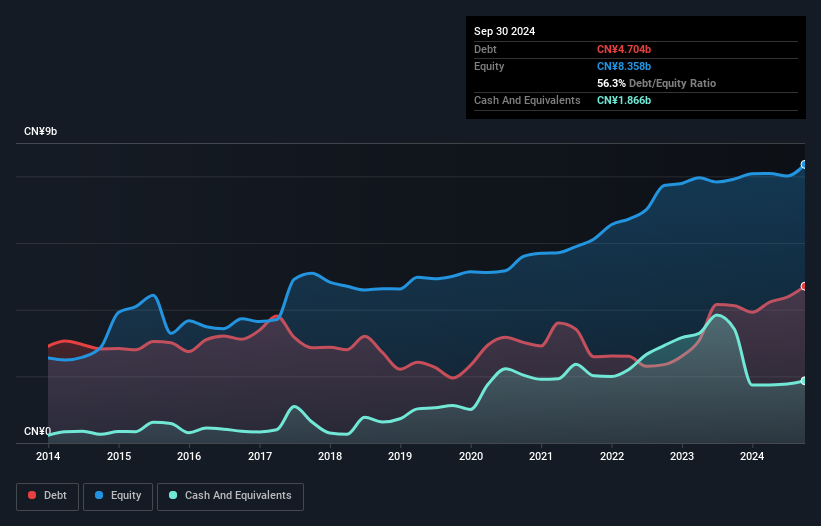
What Is Anhui Wanwei Updated High-Tech Material IndustryLtd's Debt?
You can click the graphic below for the historical numbers, but it shows that as of September 2024 Anhui Wanwei Updated High-Tech Material IndustryLtd had CN¥4.70b of debt, an increase on CN¥4.12b, over one year. However, it does have CN¥1.87b in cash offsetting this, leading to net debt of about CN¥2.84b.
A Look At Anhui Wanwei Updated High-Tech Material IndustryLtd's Liabilities
We can see from the most recent balance sheet that Anhui Wanwei Updated High-Tech Material IndustryLtd had liabilities of CN¥6.28b falling due within a year, and liabilities of CN¥829.2m due beyond that. On the other hand, it had cash of CN¥1.87b and CN¥1.86b worth of receivables due within a year. So its liabilities outweigh the sum of its cash and (near-term) receivables by CN¥3.38b.
While this might seem like a lot, it is not so bad since Anhui Wanwei Updated High-Tech Material IndustryLtd has a market capitalization of CN¥8.56b, and so it could probably strengthen its balance sheet by raising capital if it needed to. However, it is still worthwhile taking a close look at its ability to pay off debt.
We measure a company's debt load relative to its earnings power by looking at its net debt divided by its earnings before interest, tax, depreciation, and amortization (EBITDA) and by calculating how easily its earnings before interest and tax (EBIT) cover its interest expense (interest cover). Thus we consider debt relative to earnings both with and without depreciation and amortization expenses.
Weak interest cover of 1.3 times and a disturbingly high net debt to EBITDA ratio of 5.5 hit our confidence in Anhui Wanwei Updated High-Tech Material IndustryLtd like a one-two punch to the gut. This means we'd consider it to have a heavy debt load. Even worse, Anhui Wanwei Updated High-Tech Material IndustryLtd saw its EBIT tank 83% over the last 12 months. If earnings continue to follow that trajectory, paying off that debt load will be harder than convincing us to run a marathon in the rain. There's no doubt that we learn most about debt from the balance sheet. But it is future earnings, more than anything, that will determine Anhui Wanwei Updated High-Tech Material IndustryLtd's ability to maintain a healthy balance sheet going forward. So if you want to see what the professionals think, you might find this free report on analyst profit forecasts to be interesting.
Finally, a company can only pay off debt with cold hard cash, not accounting profits. So we always check how much of that EBIT is translated into free cash flow. Over the last three years, Anhui Wanwei Updated High-Tech Material IndustryLtd recorded negative free cash flow, in total. Debt is far more risky for companies with unreliable free cash flow, so shareholders should be hoping that the past expenditure will produce free cash flow in the future.
Our View
To be frank both Anhui Wanwei Updated High-Tech Material IndustryLtd's interest cover and its track record of (not) growing its EBIT make us rather uncomfortable with its debt levels. Having said that, its ability to handle its total liabilities isn't such a worry. We're quite clear that we consider Anhui Wanwei Updated High-Tech Material IndustryLtd to be really rather risky, as a result of its balance sheet health. For this reason we're pretty cautious about the stock, and we think shareholders should keep a close eye on its liquidity. The balance sheet is clearly the area to focus on when you are analysing debt. However, not all investment risk resides within the balance sheet - far from it. For instance, we've identified 3 warning signs for Anhui Wanwei Updated High-Tech Material IndustryLtd that you should be aware of.
At the end of the day, it's often better to focus on companies that are free from net debt. You can access our special list of such companies (all with a track record of profit growth). It's free.
The New Payments ETF Is Live on NASDAQ:
Money is moving to real-time rails, and a newly listed ETF now gives investors direct exposure. Fast settlement. Institutional custody. Simple access.
Explore how this launch could reshape portfolios
Sponsored ContentNew: Manage All Your Stock Portfolios in One Place
We've created the ultimate portfolio companion for stock investors, and it's free.
• Connect an unlimited number of Portfolios and see your total in one currency
• Be alerted to new Warning Signs or Risks via email or mobile
• Track the Fair Value of your stocks
Have feedback on this article? Concerned about the content? Get in touch with us directly. Alternatively, email editorial-team (at) simplywallst.com.
This article by Simply Wall St is general in nature. We provide commentary based on historical data and analyst forecasts only using an unbiased methodology and our articles are not intended to be financial advice. It does not constitute a recommendation to buy or sell any stock, and does not take account of your objectives, or your financial situation. We aim to bring you long-term focused analysis driven by fundamental data. Note that our analysis may not factor in the latest price-sensitive company announcements or qualitative material. Simply Wall St has no position in any stocks mentioned.
About SHSE:600063
Anhui Wanwei Updated High-Tech Material IndustryLtd
Provides chemicals, chemical fibers, new materials, and building materials.
Proven track record and fair value.
Market Insights

Weekly Picks

Early mover in a fast growing industry. Likely to experience share price volatility as they scale


A case for CA$31.80 (undiluted), aka 8,616% upside from CA$0.37 (an 86 bagger!).


Moderation and Stabilisation: HOLD: Fair Price based on a 4-year Cycle is $12.08
Recently Updated Narratives

Meta’s Bold Bet on AI Pays Off

ADP Stock: Solid Fundamentals, But AI Investments Test Its Margin Resilience

Visa Stock: The Toll Booth at the Center of Global Commerce
Popular Narratives


Crazy Undervalued 42 Baggers Silver Play (Active & Running Mine)


NVDA: Expanding AI Demand Will Drive Major Data Center Investments Through 2026

The AI Infrastructure Giant Grows Into Its Valuation
Trending Discussion


