Stock Analysis
- China
- /
- Personal Products
- /
- SHSE:603059
Does The Market Have A Low Tolerance For Perfect Group Corp., Ltd's (SHSE:603059) Mixed Fundamentals?


It is hard to get excited after looking at Perfect Group's (SHSE:603059) recent performance, when its stock has declined 19% over the past month. It seems that the market might have completely ignored the positive aspects of the company's fundamentals and decided to weigh-in more on the negative aspects. Long-term fundamentals are usually what drive market outcomes, so it's worth paying close attention. In this article, we decided to focus on Perfect Group's ROE.
Return on Equity or ROE is a test of how effectively a company is growing its value and managing investors’ money. In short, ROE shows the profit each dollar generates with respect to its shareholder investments.
Check out our latest analysis for Perfect Group
How Is ROE Calculated?
The formula for ROE is:
Return on Equity = Net Profit (from continuing operations) ÷ Shareholders' Equity
So, based on the above formula, the ROE for Perfect Group is:
8.2% = CN¥104m ÷ CN¥1.3b (Based on the trailing twelve months to March 2024).
The 'return' is the yearly profit. Another way to think of that is that for every CN¥1 worth of equity, the company was able to earn CN¥0.08 in profit.
What Has ROE Got To Do With Earnings Growth?
Thus far, we have learned that ROE measures how efficiently a company is generating its profits. We now need to evaluate how much profit the company reinvests or "retains" for future growth which then gives us an idea about the growth potential of the company. Assuming all else is equal, companies that have both a higher return on equity and higher profit retention are usually the ones that have a higher growth rate when compared to companies that don't have the same features.
A Side By Side comparison of Perfect Group's Earnings Growth And 8.2% ROE
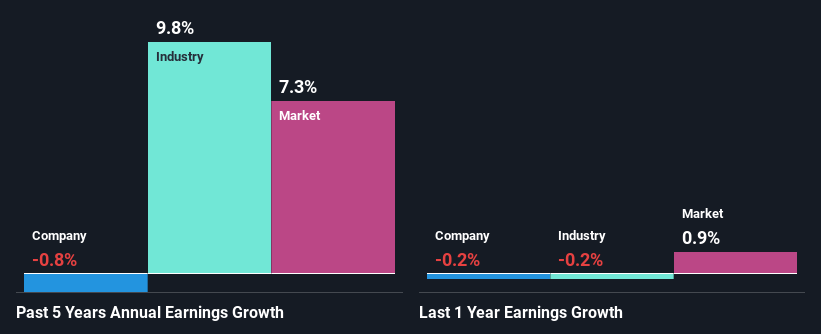
At first glance, Perfect Group's ROE doesn't look very promising. Yet, a closer study shows that the company's ROE is similar to the industry average of 10%. Having said that, Perfect Group's net income growth over the past five years is more or less flat. Remember, the company's ROE is not particularly great to begin with. Hence, this provides some context to the flat earnings growth seen by the company.
As a next step, we compared Perfect Group's net income growth with the industry and discovered that the industry saw an average growth of 9.8% in the same period.
Earnings growth is an important metric to consider when valuing a stock. What investors need to determine next is if the expected earnings growth, or the lack of it, is already built into the share price. This then helps them determine if the stock is placed for a bright or bleak future. Is Perfect Group fairly valued compared to other companies? These 3 valuation measures might help you decide.
Is Perfect Group Making Efficient Use Of Its Profits?
Perfect Group has a low three-year median payout ratio of 21% (or a retention ratio of 79%) but the negligible earnings growth number doesn't reflect this as high growth usually follows high profit retention.
Additionally, Perfect Group has paid dividends over a period of five years, which means that the company's management is determined to pay dividends even if it means little to no earnings growth.
Conclusion
In total, we're a bit ambivalent about Perfect Group's performance. While the company does have a high rate of reinvestment, the low ROE means that all that reinvestment is not reaping any benefit to its investors, and moreover, its having a negative impact on the earnings growth. Having said that, looking at current analyst estimates, we found that the company's earnings growth rate is expected to see a huge improvement. To know more about the latest analysts predictions for the company, check out this visualization of analyst forecasts for the company.
Valuation is complex, but we're helping make it simple.
Find out whether Perfect Group is potentially over or undervalued by checking out our comprehensive analysis, which includes fair value estimates, risks and warnings, dividends, insider transactions and financial health.
View the Free AnalysisHave feedback on this article? Concerned about the content? Get in touch with us directly. Alternatively, email editorial-team (at) simplywallst.com.
This article by Simply Wall St is general in nature. We provide commentary based on historical data and analyst forecasts only using an unbiased methodology and our articles are not intended to be financial advice. It does not constitute a recommendation to buy or sell any stock, and does not take account of your objectives, or your financial situation. We aim to bring you long-term focused analysis driven by fundamental data. Note that our analysis may not factor in the latest price-sensitive company announcements or qualitative material. Simply Wall St has no position in any stocks mentioned.
Valuation is complex, but we're helping make it simple.
Find out whether Perfect Group is potentially over or undervalued by checking out our comprehensive analysis, which includes fair value estimates, risks and warnings, dividends, insider transactions and financial health.
View the Free AnalysisHave feedback on this article? Concerned about the content? Get in touch with us directly. Alternatively, email editorial-team@simplywallst.com
About SHSE:603059
Perfect Group
Provides manual and electric toothbrushes in the People’s Republic of China.
Reasonable growth potential with adequate balance sheet.
