
Advertisement
- China
- /
- Healthcare Services
- /
- SZSE:300244
Dian Diagnostics Group Co.,Ltd.'s (SZSE:300244) Shares Bounce 37% But Its Business Still Trails The Industry
Dian Diagnostics Group Co.,Ltd. (SZSE:300244) shareholders would be excited to see that the share price has had a great month, posting a 37% gain and recovering from prior weakness. Unfortunately, the gains of the last month did little to right the losses of the last year with the stock still down 42% over that time.
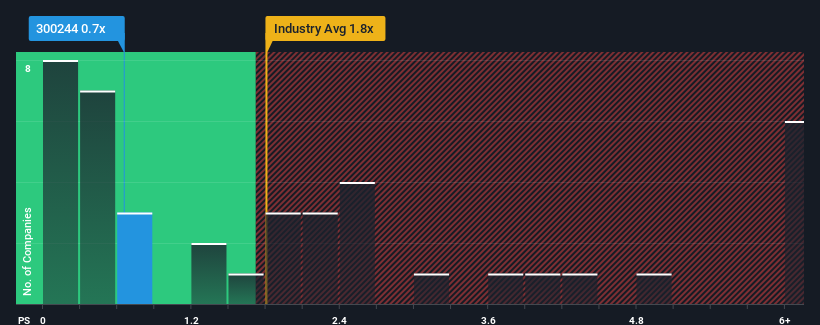
In spite of the firm bounce in price, when close to half the companies operating in China's Healthcare industry have price-to-sales ratios (or "P/S") above 1.8x, you may still consider Dian Diagnostics GroupLtd as an enticing stock to check out with its 0.7x P/S ratio. However, the P/S might be low for a reason and it requires further investigation to determine if it's justified.
Check out our latest analysis for Dian Diagnostics GroupLtd
What Does Dian Diagnostics GroupLtd's Recent Performance Look Like?
Dian Diagnostics GroupLtd hasn't been tracking well recently as its declining revenue compares poorly to other companies, which have seen some growth in their revenues on average. It seems that many are expecting the poor revenue performance to persist, which has repressed the P/S ratio. So while you could say the stock is cheap, investors will be looking for improvement before they see it as good value.
Keen to find out how analysts think Dian Diagnostics GroupLtd's future stacks up against the industry? In that case, our free report is a great place to start.Is There Any Revenue Growth Forecasted For Dian Diagnostics GroupLtd?
The only time you'd be truly comfortable seeing a P/S as low as Dian Diagnostics GroupLtd's is when the company's growth is on track to lag the industry.
In reviewing the last year of financials, we were disheartened to see the company's revenues fell to the tune of 22%. That put a dampener on the good run it was having over the longer-term as its three-year revenue growth is still a noteworthy 6.8% in total. So we can start by confirming that the company has generally done a good job of growing revenue over that time, even though it had some hiccups along the way.
Shifting to the future, estimates from the eleven analysts covering the company suggest revenue should grow by 7.8% over the next year. With the industry predicted to deliver 14% growth, the company is positioned for a weaker revenue result.
With this information, we can see why Dian Diagnostics GroupLtd is trading at a P/S lower than the industry. It seems most investors are expecting to see limited future growth and are only willing to pay a reduced amount for the stock.
The Key Takeaway
The latest share price surge wasn't enough to lift Dian Diagnostics GroupLtd's P/S close to the industry median. Using the price-to-sales ratio alone to determine if you should sell your stock isn't sensible, however it can be a practical guide to the company's future prospects.
We've established that Dian Diagnostics GroupLtd maintains its low P/S on the weakness of its forecast growth being lower than the wider industry, as expected. Right now shareholders are accepting the low P/S as they concede future revenue probably won't provide any pleasant surprises. The company will need a change of fortune to justify the P/S rising higher in the future.
Before you take the next step, you should know about the 2 warning signs for Dian Diagnostics GroupLtd that we have uncovered.
Of course, profitable companies with a history of great earnings growth are generally safer bets. So you may wish to see this free collection of other companies that have reasonable P/E ratios and have grown earnings strongly.
New: Manage All Your Stock Portfolios in One Place
We've created the ultimate portfolio companion for stock investors, and it's free.
• Connect an unlimited number of Portfolios and see your total in one currency
• Be alerted to new Warning Signs or Risks via email or mobile
• Track the Fair Value of your stocks
Have feedback on this article? Concerned about the content? Get in touch with us directly. Alternatively, email editorial-team (at) simplywallst.com.
This article by Simply Wall St is general in nature. We provide commentary based on historical data and analyst forecasts only using an unbiased methodology and our articles are not intended to be financial advice. It does not constitute a recommendation to buy or sell any stock, and does not take account of your objectives, or your financial situation. We aim to bring you long-term focused analysis driven by fundamental data. Note that our analysis may not factor in the latest price-sensitive company announcements or qualitative material. Simply Wall St has no position in any stocks mentioned.
About SZSE:300244
Dian Diagnostics GroupLtd
Provides integrated medical diagnostics solutions with independent diagnostic services in China.
Flawless balance sheet, undervalued and pays a dividend.
Market Insights

Advertisement
Community Narratives
MINISO's fair value is projected at 26.69 with an anticipated PE ratio shift of 20x
Fair Value US$24.03|11.4% undervalued
BE
Community Contributor
Procter & Gamble: A Dividend Giant Facing Slowing Growth
Fair Value US$119.81|23.5% overvalued
AN
Community Contributor
Eli Lilly's Future Growth Driven by Tirzepatide and Favorable Market Conditions
Fair Value US$1.19k|14.0% undervalued
EA
Community Contributor